Support

Peer-to-peer (P2P) RV rentals let owners rent their vehicles directly to travelers through online platforms. This approach offers both cost savings and flexibility, compared to traditional rental companies.
How big is the RV rental market?
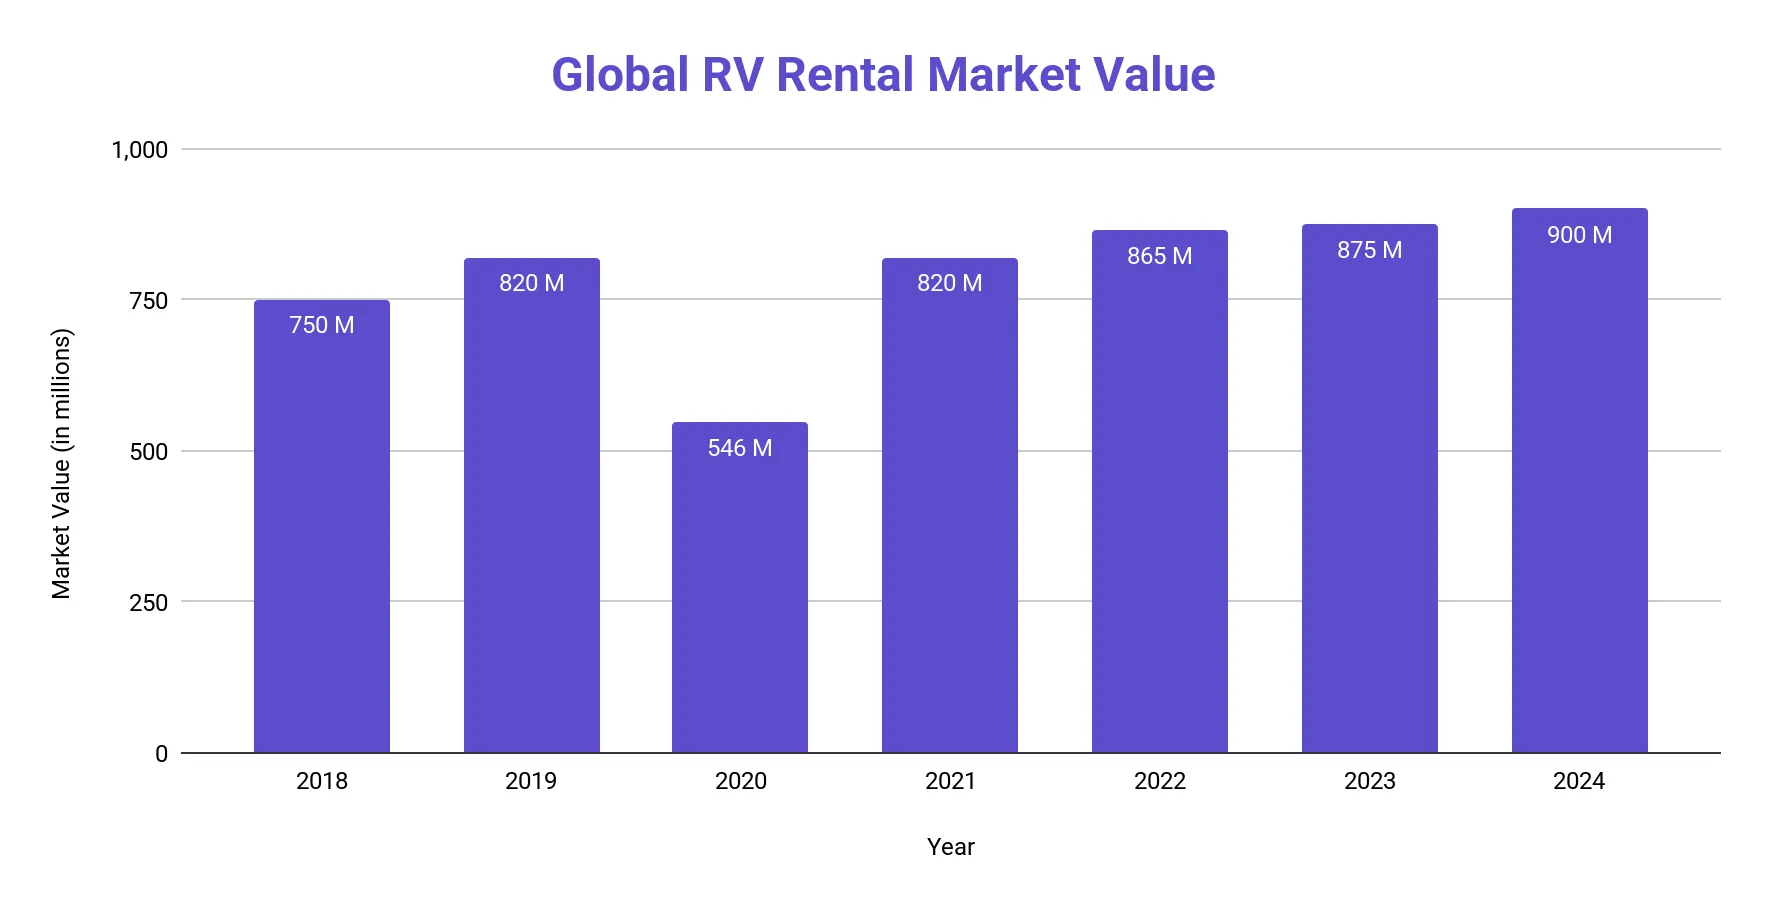
The global RV rental market was valued at approximately $875 million in 2023, growing steadily by about 3% to reach approximately $900 million in 2024.
- The market had previously experienced a decline in 2020, dropping to $546 million due to the pandemic, but recovered to $820 million in 2021 and continued expanding in subsequent years.
- By 2024, the P2P RV rental market reached approximately $195 million (22% of the total $900 million market), up from $175 million in 2023 (20%).
What percentage of RV rentals are peer-to-peer?
In 2024, peer-to-peer (P2P) RV rentals accounted for approximately 22% of the total RV rental market, contributing $195 million to the overall $900 million market.
- In 2019, P2P RV rentals represented approximately 13% of the total market ($105 million within the $820 million total).
- During the pandemic in 2020, the P2P segment slightly declined to $87 million, but retained a 16% share as the total RV rental market dropped to $546 million.
- The P2P market recovered post-pandemic, reaching $128 million in 2021 (16% of the $820 million market) and continued to grow, rising to $175 million in 2023 (20% of the $875 million market).
- By 2024, the P2P market expanded to $195 million, comprising 22% of the total $900 million RV rental market.
| Year | Total RV Rental Market Size (USD Millions) | P2P RV Rental Market Size (USD Millions) | P2P Market Share (%) |
|---|---|---|---|
| 2017 | $720.0 | $58.0 | 8% |
| 2018 | $750.0 | $75.0 | 10% |
| 2019 | $820.0 | $105.0 | 13% |
| 2020 | $546.0 | $87.0 | 16% |
| 2021 | $820.0 | $128.0 | 16% |
| 2022 | $865.0 | $155.0 | 18% |
| 2023 | $875.0 | $175.0 | 20% |
| 2024 | $900.0 | $195.0 | 22% |
Top Companies for P2P RV Rental
Outdoorsy stands out as the most popular RV rental platform, boasting 7 million trips (1 million bookings), 160 million miles rented, and a presence in 14 countries.
Top Companies by Year of Establishment
RVshare (Established in 2013)
- Over 4 million nights booked and 127 million miles rented.
- Features 100,000+ RVs available across 50 U.S. states.
- Connects 60,000 RV owners to renters nationwide.
Outdoorsy (Established in 2015)
- Facilitated 7 million trips (1 million bookings) and 160 million miles rented.
- Operates in 14 countries with 900,000 owners and renters.
- Annually attracts 40 million searches from customers.
RVezy (Established in 2017)
- Achieved 1 million nights booked with 10,000 RVs available for rent.
- Features 30,000 RV owners and operates in 2 countries.
Yescapa (Established in 2012)
- Reached 1 million bookings with a community of 500,000 customers.
- Provides access to 14,000 RV owners across 7 countries.
| Platform | Nights / Bookings Since Established | Miles Rented | RVs Available | Owners | Available in | Additional Stats |
|---|---|---|---|---|---|---|
| RVshare | 4 million nights booked | 127 million miles | 100,000+ | 60,000 | 50 U.S. states | N/A |
| Outdoorsy | 7 million trips / 1 million bookings | 160 million miles | Not specified | 900,000 (owners & renters) | 14 countries | 40 million customers searched annually |
| RVezy | 1 million nights booked | Not specified | 10,000 | 30,000 | 2 countries | N/A |
| Yescapa | 1 million bookings | Not specified | Not specified | 14,000 | 7 countries | 500,000 customers |
Major Companies and Market Share
The RV rental market features a mix of traditional fleet-based companies and newer peer-to-peer platforms. Traditional rental companies still control about 78% of the market, though their share has been steadily declining as P2P platforms gain traction.
| Traditional vs. P2P Market Share (2024) | ||
|---|---|---|
| Company Type | Market Share | Market Value (USD Millions) |
| Traditional Rental Companies | 78% | $705 |
| P2P Platforms | 22% | $195 |
| Total | 100% | $900 |
Leading Traditional Rental Companies
- Cruise America: Controls approximately 30% of the traditional rental market with a fleet of 4,000+ vehicles across 130 rental locations in North America.
- El Monte RV: Holds roughly 12% of the traditional market with operations in 50+ locations nationwide.
- Apollo RV: Claims about 8% of the traditional market, with a strong presence in the international sector across the U.S., Australia, and New Zealand.
P2P Platform Market Dominance
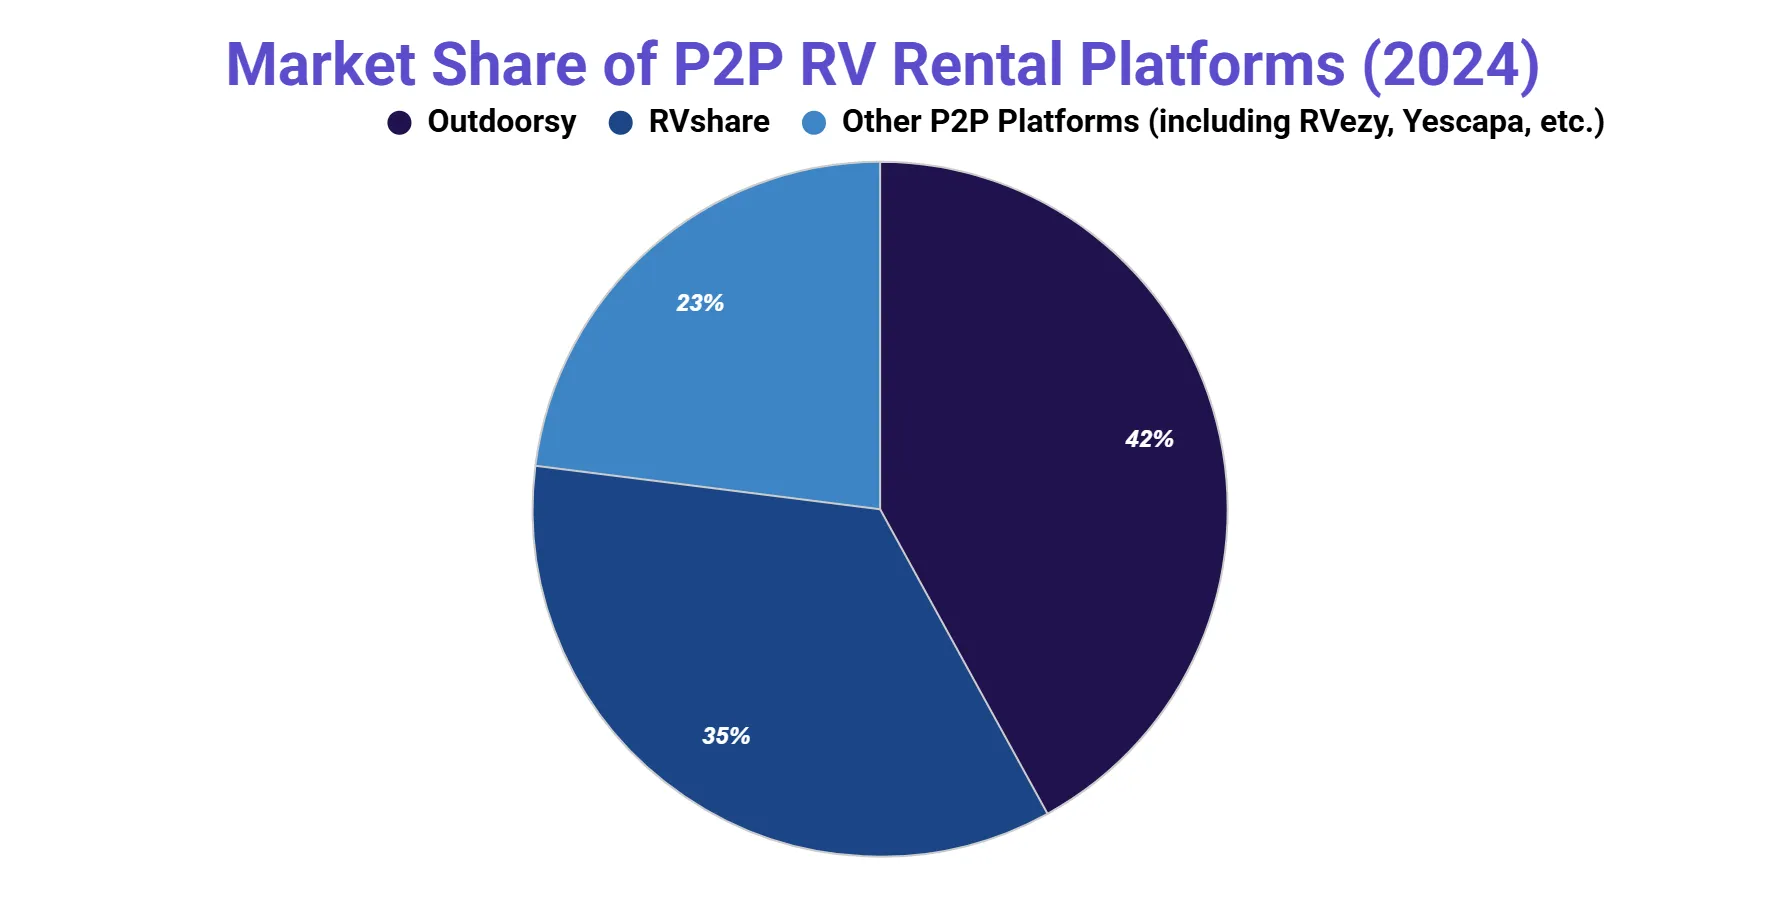
- Outdoorsy: Controls approximately 42% of the P2P segment (about 9% of the total RV rental market).
- RVshare: Claims roughly 35% of the P2P segment (approximately 8% of the total market).
- Other P2P Platforms (including RVezy, Yescapa, etc.): Together represent the remaining 23% of the P2P segment (about 5% of the total market).
RV Owner & Renter Demographics
In 2024, U.S. RV ownership reached 11.2 million households, reflecting a steady 2-3% annual increase. Since 2001, total RV ownership has grown by approximately 62%.
Who are the typical RV owners renting out their vehicles?
- Millennials and Gen Z (18-34) now represent 22% of RV owners. However, most P2P RV rentals are provided by Gen X and Baby Boomer owners, who still constitute the majority of the rental supply.
- An estimated 9.6 million U.S. households plan to purchase an RV within the next five years, indicating continued growth in the industry.
Which Region has the most RV renters?
North America remains the largest market for RV rentals, with approximately 13.3 million RV users.
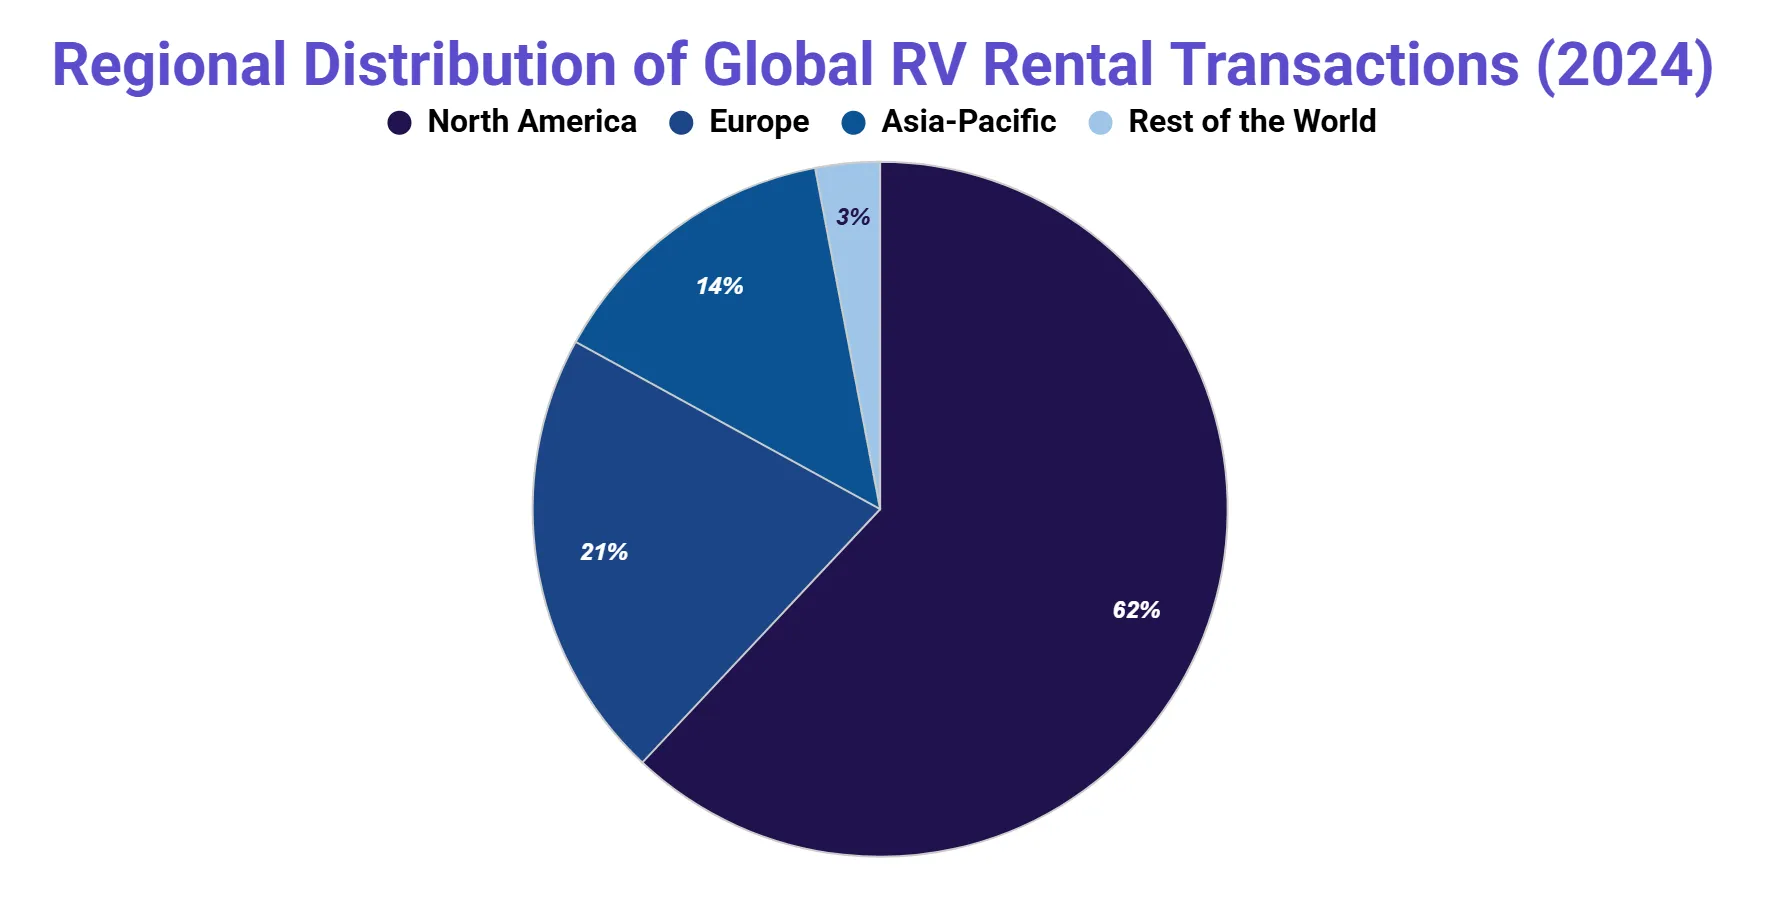
- The RV rental industry facilitated approximately 4.5 million rental transactions globally in 2024, with North America accounting for roughly 2.8 million (62%) of these bookings.
- Europe saw about 950,000 transactions (21%), while the Asia-Pacific region recorded around 650,000 (14%).
How much does it cost to rent an RV?
RV rental costs range from average budget-friendly options like pop-up trailers at $50-$100 per day to luxurious Class A motorhomes at $175-$350 per day or $1,000-$2,000 per week.
Breakdown:
- Motorhomes (Drivable)
- Class A: $175 - $350 per day; $1,000 - $2,000 per week
- Class B: $125 - $250 per day; $750 - $1,500 per week
- Class C: $150 - $300 per day; $900 - $1,800 per week
- Towable Campers
- Travel Trailers: $50 - $200 per day; $350 - $1,000 per week
- Fifth Wheels: $60 - $300 per day
- Pop-Up Trailers: $50 - $100 per day
How much income can RV owners earn through P2P platforms?
RV owners can potentially earn between $10,000 and $30,000 annually, or at least $800 per month, by renting out their RVs through P2P platforms, depending on usage and pricing strategies.
How long do people typically rent RVs for?
RV rentals are popular for weekend trips (2-3 days), weekly vacations (7 days, especially for families), and longer journeys (10-14 days) for cross-country or extended travel.
- Weekend Rentals: Many renters opt for short trips, often renting RVs for 2 to 3 days over a weekend.
- Weekly Rentals: A significant number of rentals last about a week, with 7 days being a popular choice for families and vacationers.
- Longer Rentals: Some travelers rent RVs for extended periods, such as 10 to 14 days, particularly for cross-country trips or longer vacations.
| Rental Duration | Description |
|---|---|
| Weekend (2-3 days) | Ideal for quick getaways |
| Weekly (7 days) | Common for vacations |
| Extended (10-14 days) | For longer road trips |
RV rental in the USA
All about RVs - Size and Park Trends
How long is the average RV?
RV sizes range from compact models as small as 10 feet (travel trailers) to large Class A motorhomes up to 45 feet.
- Compact Models: Approximately 20 feet. These include smaller travel trailers and camper vans.
- Class B Motorhomes: Generally range from 20 to 25 feet.
- Class C Motorhomes: Typically between 20 to 35 feet.
- Class A Motorhomes: Can be quite large, ranging from 26 to 45 feet, with many popular models around 30 to 40 feet.
- Travel Trailers: Usually range from 10 to 35 feet, with the most common length being around 25 feet.
- Fifth Wheels: Typically range from 25 to 40 feet, with many models falling around 30 to 38 feet.
| RV Type | Average Length |
|---|---|
| Compact Models | 20 feet |
| Class B | 20 - 25 feet |
| Class C | 20 - 35 feet |
| Class A | 26 - 45 feet |
| Travel Trailers | 10 - 35 feet (avg. 25 feet) |
| Fifth Wheels | 25 - 40 feet (avg. 30-38 feet) |
Major Destinations for RV Rentals
The most popular RV rental hubs often serve as gateways to national parks and scenic routes. Unlike car rentals that cluster around airports, RV rentals concentrate near natural attractions and along major road trip corridors.
Top RV Rental Hubs in the United States
- Las Vegas, NV: Serves as the primary jumping-off point for Grand Canyon, Zion, and Death Valley adventures, with over 120,000 annual RV rentals.
- Denver, CO: Gateway to Rocky Mountain National Park and Colorado's mountain towns, recording approximately 95,000 RV rentals yearly.
- Orlando, FL: Popular for family vacations combining theme parks with beach exploration, averaging 85,000 RV rentals annually.
- Salt Lake City, UT: Access point to Utah's "Mighty 5" national parks, with roughly 80,000 yearly RV rentals.
- Portland, OR: Starting point for Pacific Northwest exploration including Mount Hood and the Oregon Coast, with about 75,000 annual rentals.
Most Popular RV Road Trip Corridors
- Pacific Coast Highway (California): Attracts approximately 250,000 RV travelers annually.
- Blue Ridge Parkway (Virginia/North Carolina): Sees roughly 180,000 RV adventurers each year.
- Route 66 (Chicago to Santa Monica): Draws about 165,000 RV enthusiasts yearly.
- Great Lakes Circle Tour: Records approximately 140,000 RV travelers annually.
National parks remain the ultimate destinations for most RV renters, with Yellowstone, Grand Canyon, and Yosemite consistently ranking as the top three destinations for RV travelers, collectively drawing over 500,000 RV rentals each year.
References
- Global Growth Insights — RV Rental Market Sizeglobalgrowthinsights.com