

Updated
Camping is a popular outdoor activity in Europe, drawing both domestic and international visitors. Many people across Europe enjoy camping due to the variety of landscapes and the increasing focus on nature-based tourism.
Key Camping Trends in Europe
- 93.13 million visitors stayed at camping grounds, recreational vehicle parks, and trailer parks in 2024.
- The total number of nights spent in camping accommodations reached 408.86 million in 2024, a 0.38% increase from 407.33 million in 2023.
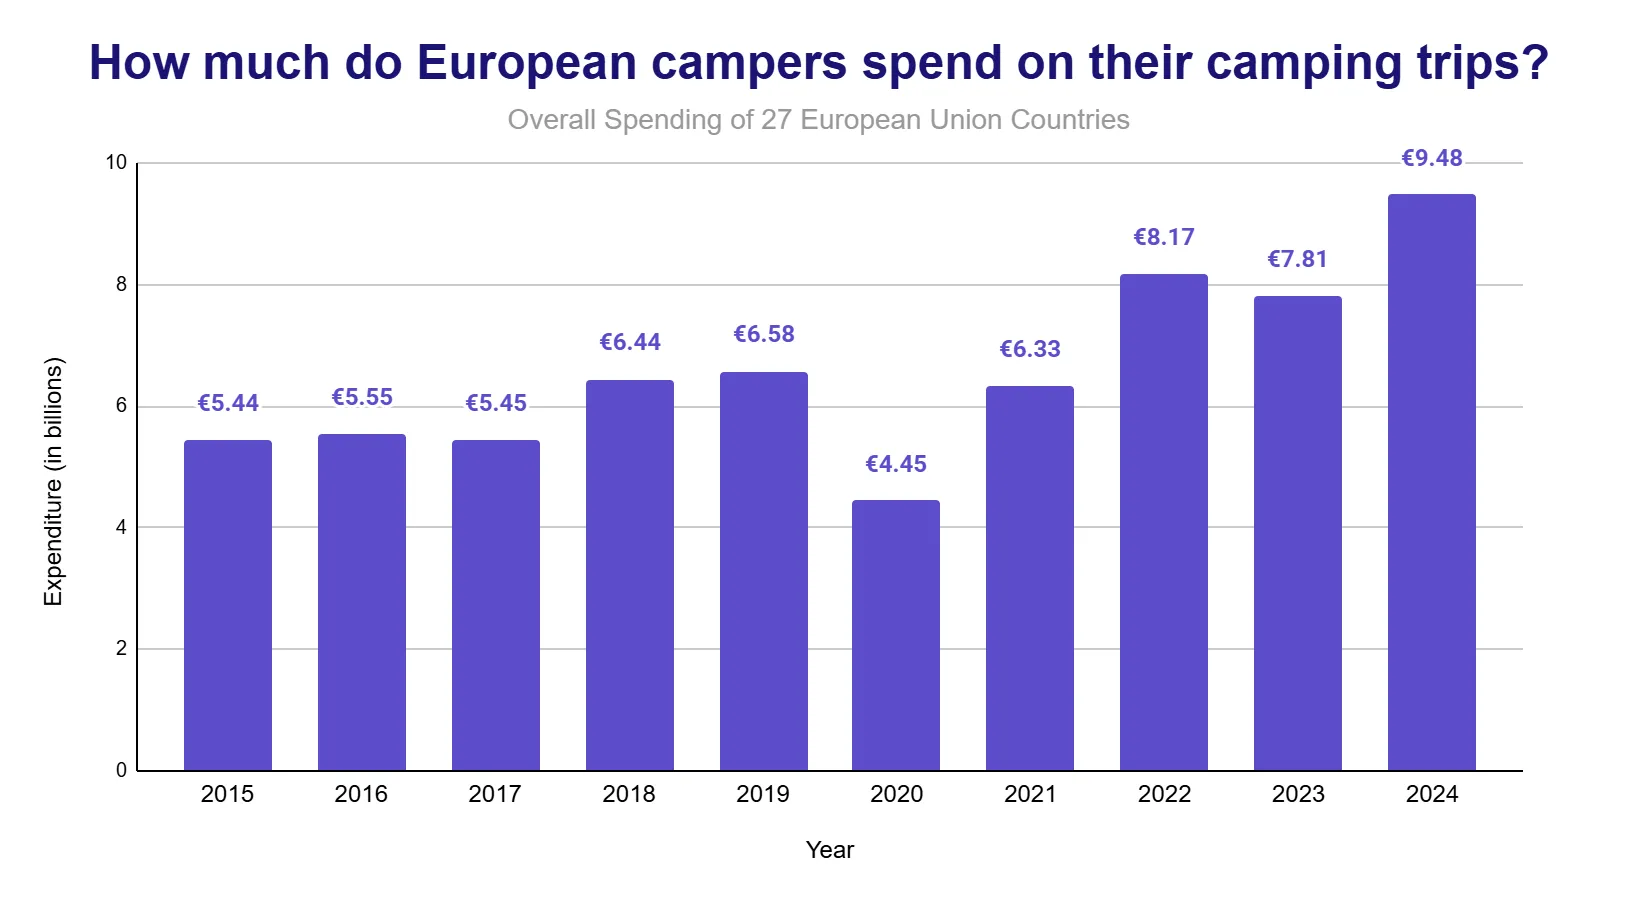
- European campers spent €9.48 billion in 2024, a 21.4% increase from the €7.81 billion spent in 2023.
- France led with 147.85 million nights spent in 2024, generating a total spending of €2.34 billion.
- £12.2 billion in visitor expenditure contributed to the UK holiday park and campsite sector in 2023.
How many people go camping every year?
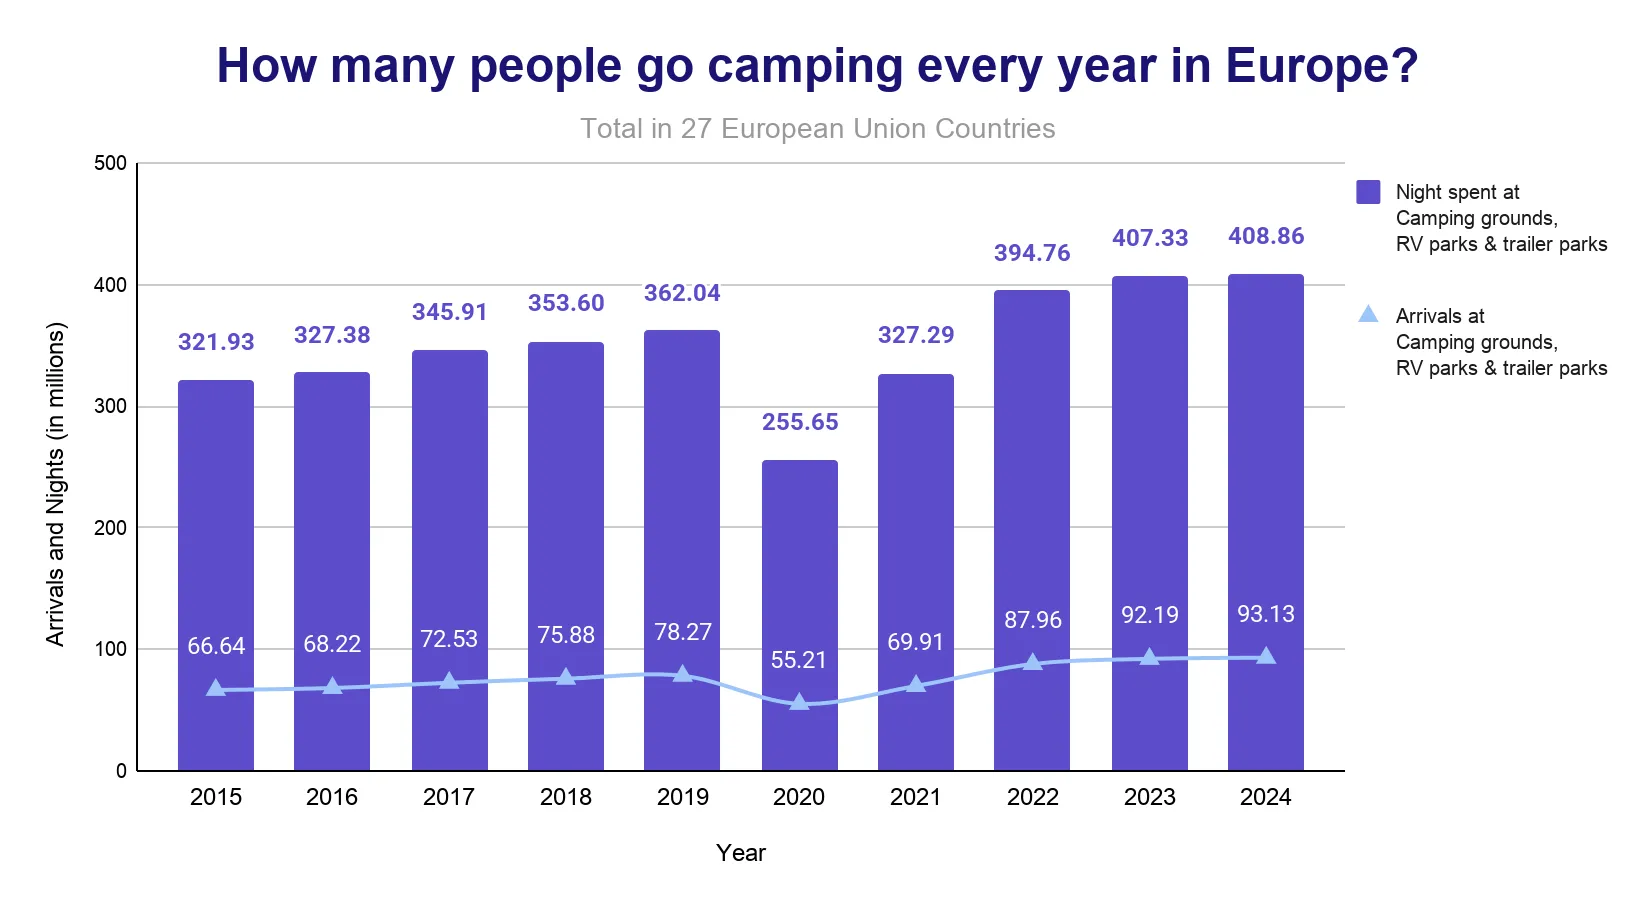
Europe's camping grounds, recreational vehicle parks, and trailer parks welcomed 93.13 million visitors in 2024.
- This represented a 1.02% increase compared to 2023, when 92.19 million visitors were recorded.
- The total number of nights spent at camping facilities across the 27 European Union countries reached 408.86 million in 2024, showing a 0.38% rise compared to 407.33 million nights in 2023.
How much do campers spend on their camping trips?
Campers in the 27 European Union member states spent €7.81 billion in 2023. However, this increased to €9.48 billion in 2024.
Which country had the most nights spent at campsites?
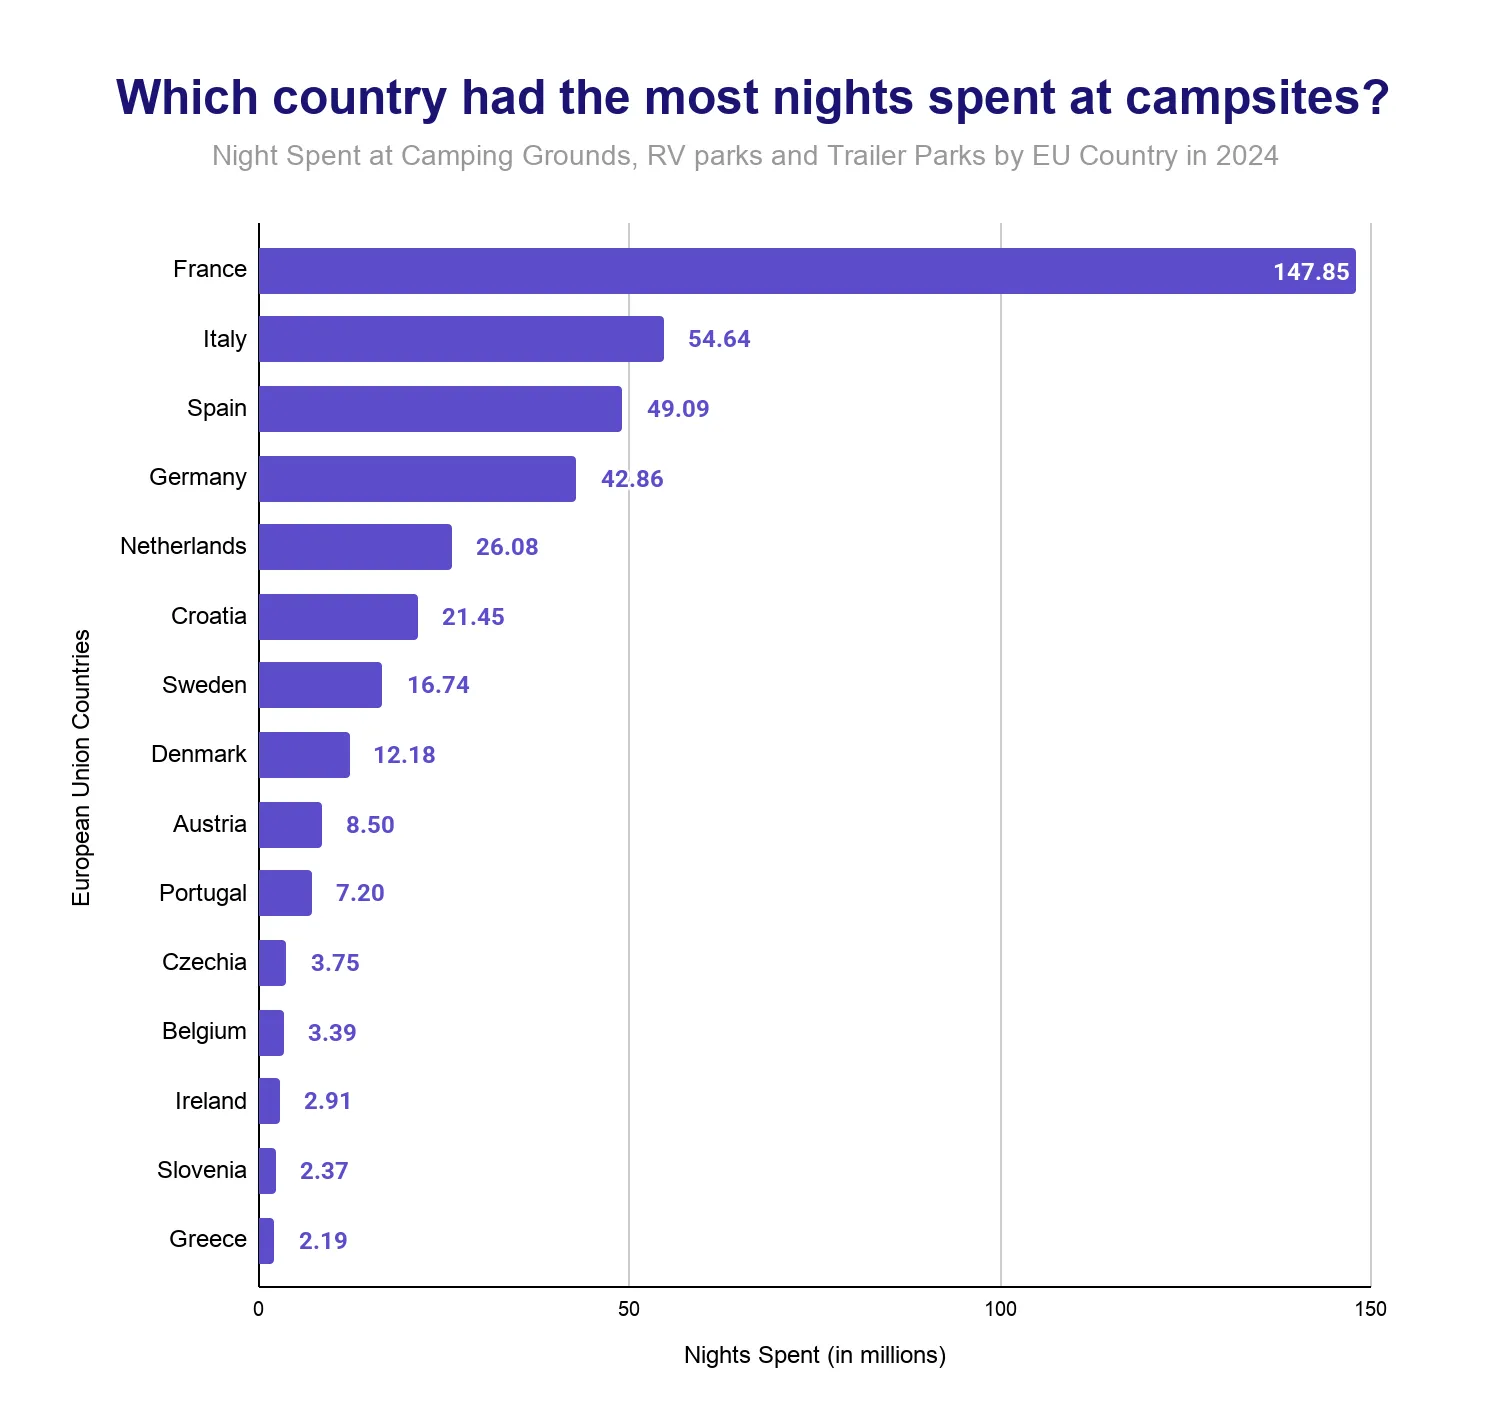
France recorded the highest number of nights spent at campsites among European Union countries in 2024, with 147.85 million nights, representing a slight decrease compared to 147.99 million in 2023.
- Italy recorded 54.64 million nights in 2024, little changed from 2023. This was 75% higher than in 2020.
- Spain recorded 49.09 million nights, an increase of 4.3% from 2023, and a 127.6% increase from 2020.
- Germany documented 42.86 million nights at campsites in 2024, showing a 1.4% increase from 2023.
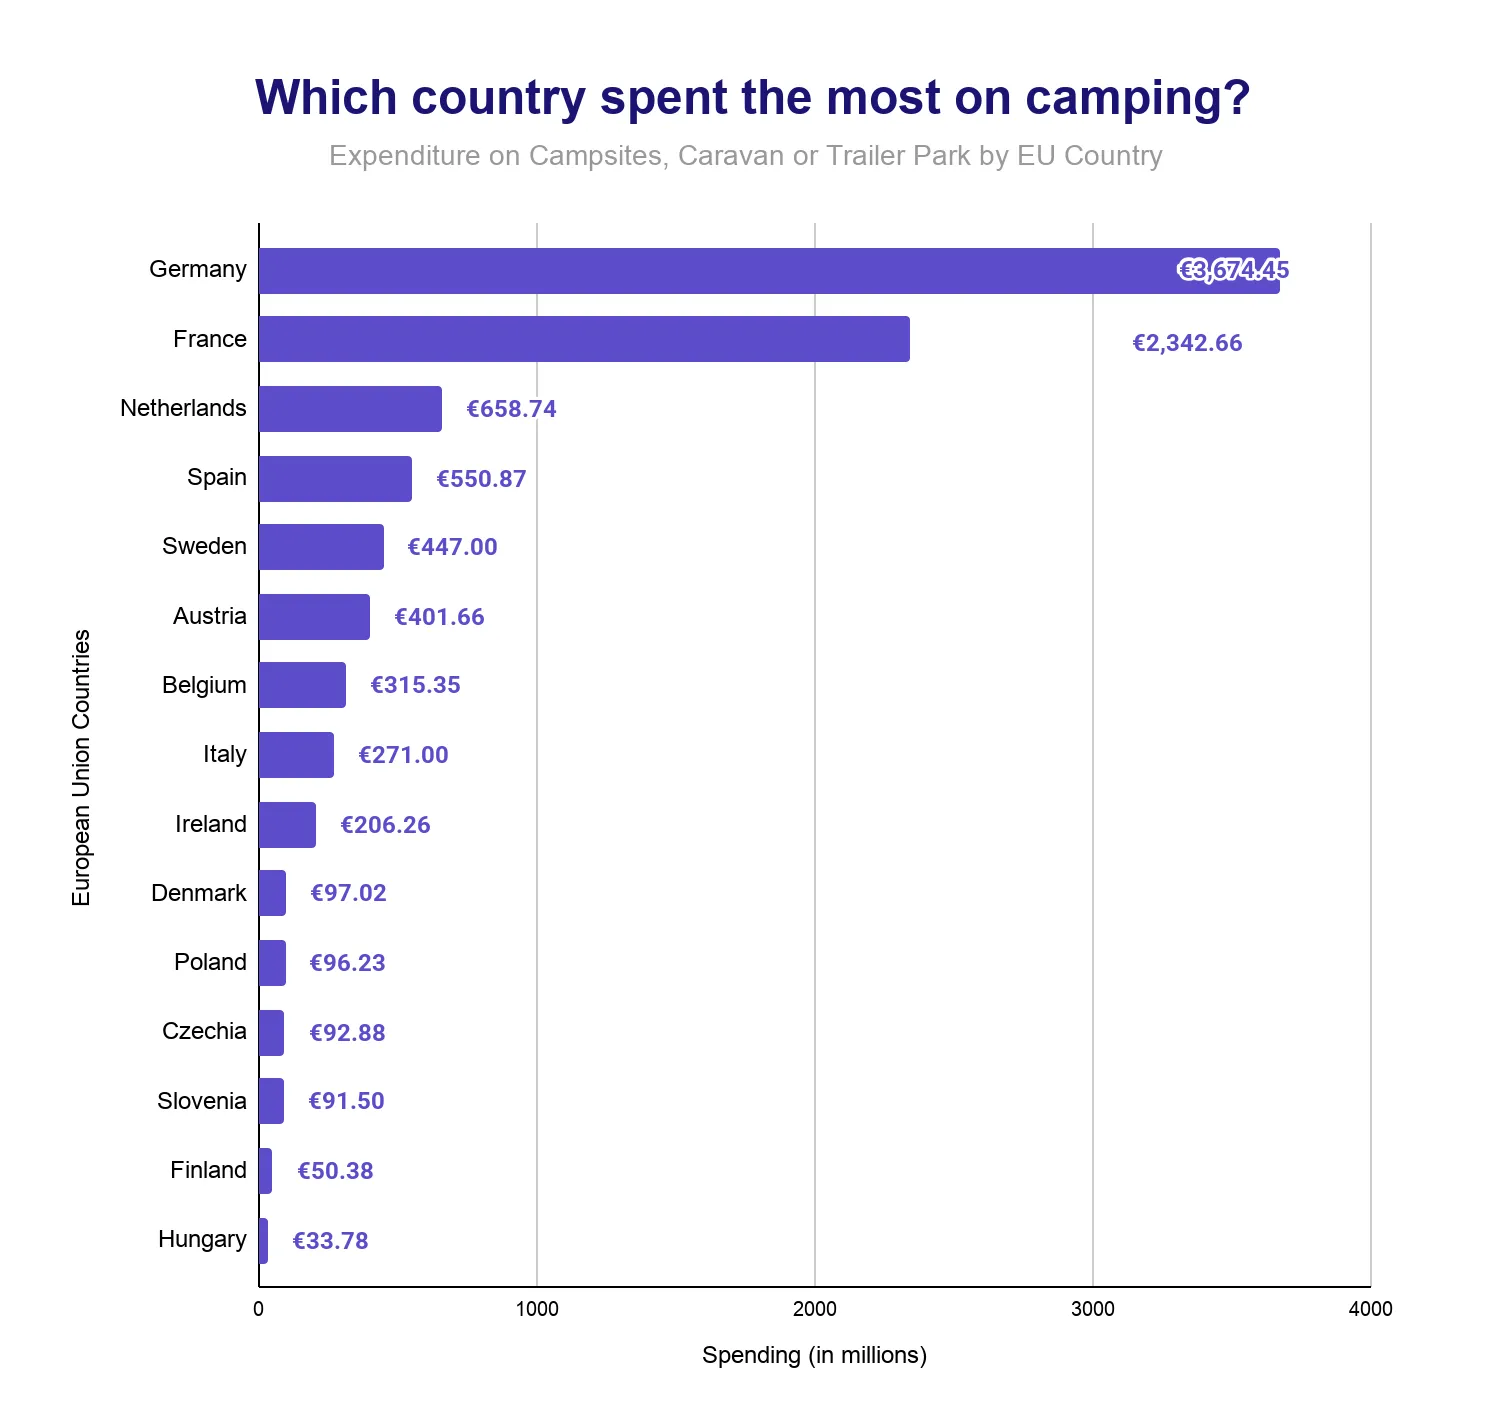
Which country spent the most on camping trips?
Germany recorded the highest camping expenditure among European Union countries in 2024, with residents spending €3.67 billion.
This reflected a 64.2% increase compared to 2023 when tourist expenditure amounted to €2.24 billion.
- France followed with €2.34 billion in tourist spending on camping trips in 2024. This represented a slight increase from €2.33 billion in 2023.
- The Netherlands had the third-highest camping expenditure at €658.74 million in 2024.
- In Spain, camping expenditure reached €550.87 million in 2024, showing a 5.7% decrease compared to €583.89 million in 2023.
- Sweden recorded €447 million in spending in 2024.
How did COVID-19 impact the camping industry in Europe?
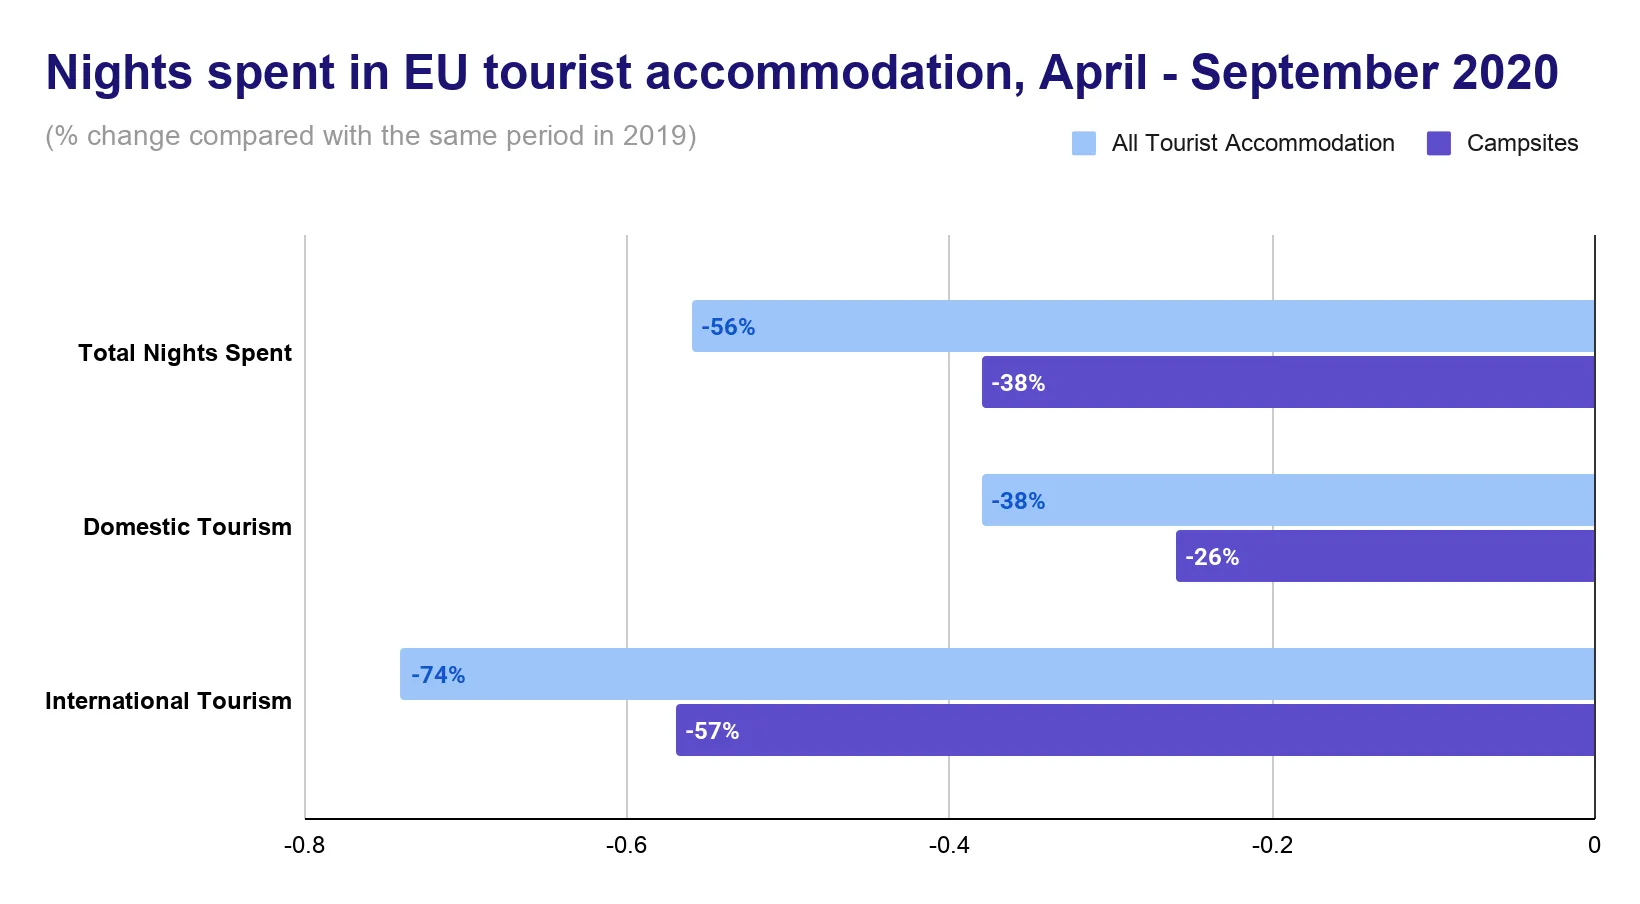
Camping in the European Union (EU) countries experienced a decline in 2020 due to the COVID-19 pandemic.
- The number of nights spent in EU tourist accommodations dropped by 56% from April to September 2020 compared to the same period in 2019 (April - September).
- Camping was the least affected type of accommodation, with a 38% decrease.
- International tourists saw a sharper decline (-57%), while domestic tourism decreased by 26%.
- Slovenia recorded a 76% increase in nights spent by domestic tourists, followed by Austria with a 32% increase, and Belgium with a 25% increase.
- Greece saw the largest decrease in nights spent at campsites, with a 57% decline.
- Estonia, Lithuania, Croatia, and Spain also recorded reductions of more than 50%.
- Germany, Denmark, Czechia, and The Netherlands observed the smallest declines, at less than 5%.
How has technology influenced the camping industry?
Technology has reshaped the camping industry by increasing accessibility, convenience, and the overall experience for campers.
- Nearly 50% of global campers now use mobile apps to plan their trips, search for campsites, and book accommodations. Websites like Camperguru offer detailed insights into their users' preferences and camping destinations in Europe.
How long do campers typically stay at campsites?
- 38.5% of campers stay for 2 to 3 nights
- 23.5% stay for just 1 night
- 18.5% stay between 4 to 6 nights
- 19.5% stay for over 7 nights
Camping Demographics: Who camps the most?
- 31% of campers are middle-aged couples
- 17.5% are families with older children
- 15.5% are senior couples
- Other categories include young couples (13.5%), families with babies (11.5%), solo travellers (7.5%), and single parents (3.5%).
What type of camping experiences are most popular?
- 19% of campers prefer the beach and relaxation.
- 16% focus on sports, hiking, and exploration.
- 14% enjoy nature and farm settings, while 12% are food and coffee enthusiasts.
- Other interests include history (11%), wine tasting (10%), family fun and pet-friendly activities (7% each), and winter sports (4%).
UK Camping Statistics 2023
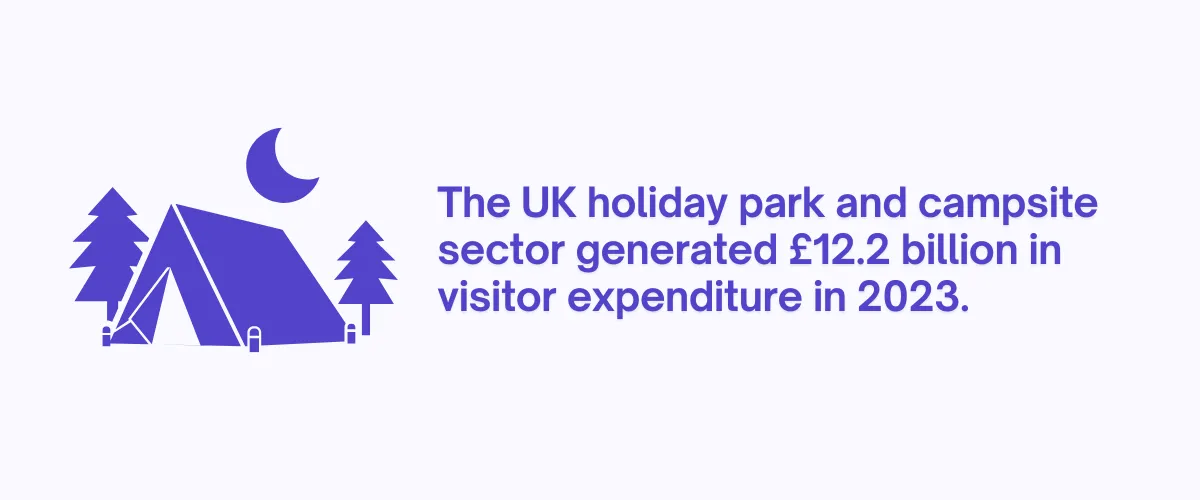
The UK holiday park and campsite sector generated £12.2 billion in visitor expenditure in 2023, contributing £7.2 billion in Gross Value Added (GVA) to the UK economy.
- The sector supported 226,745 full-time jobs and accounted for 5% of the UK's tourism GDP.
- Visitors to UK holiday parks and campsites stayed 82% longer and spent 12% more than the average tourist.
- In England, there were 4,754 holiday parks and campsites with 320,901 pitches in 2023. The sector generated £9.2 billion in visitor expenditure (equivalent to £5.45 billion GVA) and supported 170,429 jobs.
- Scotland had 401 holiday parks and campsites with 35,093 pitches. The sector generated £991.1 million in visitor expenditure and contributed £565 million in GVA, supporting 18,354 FTE jobs.
- In Wales, 922 holiday parks and campsites offered 69,088 pitches. The sector generated £1.66 billion in visitor expenditure and contributed £945.9 million in GVA, supporting 30,726 FTE jobs.
- Northern Ireland had 92 holiday parks and campsites with 14,746 pitches in 2023. The sector generated £390.7 million in visitor expenditure and contributed £205.7 million GVA, supporting 7,236 FTE jobs.
Market Share and Outlook for Europe’s Camping Industry
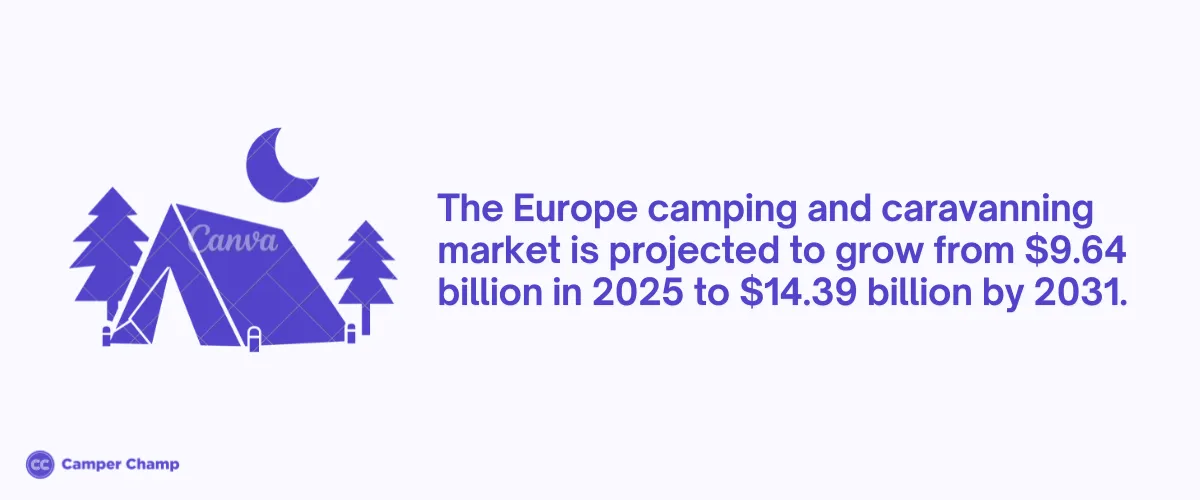
The camping and caravanning market across Europe (including both EU and non-EU countries) is forecast to grow from $9.64 billion in 2025 to $10.31 billion in 2026. It is further projected to reach $14.39 billion by 2031, expanding at a compound annual growth rate (CAGR) of 6.90% between 2026 and 2031.
This growth is driven by the increasing popularity of outdoor tourism, affordable vacation options, and the rise in road trips and RV camping.
- Across Europe, camping grounds are projected to reach 30,000 sites and surpass €9.4 billion in revenue by 2026.
- France had the most camping grounds in 2021 with 8,030 sites, followed by the UK, Germany, and The Netherlands. France is expected to generate €2.7 billion in revenue from camping grounds by 2026, up from €2.5 billion in 2021.
- In Spain, revenue from camping grounds is projected to reach €567.8 million by 2026, an annual increase of 0.4% from €474.2 million in 2021. The number of campsites is also forecast to grow to 1,350 establishments by 2026.
Other Resources
Tables and Figures: Arrivals, Nights Spent and Expenditure by Country
The tables below present arrivals, nights spent, and expenditure at camping grounds, recreational vehicle parks, and trailer parks across the 27 European Union member states from 2019 to 2024.
Motorhome rental in Europe
- Europe motorhome rental
- Dublin motorhome rental
- Campervan hire in Edinburgh
- Motorhome rental in Greece
- Hungary motorhome rental
- Motorhome rental in Munich
- Rome motorhome rental
- Motorhome rental in Stockholm
- Motorhome rental in Zagreb
- Zurich motorhome rental
| Arrivals at Camping Grounds, Recreational Vehicle Parks and Trailer Parks (by International + Domestic Visitors) | ||||||
|---|---|---|---|---|---|---|
| Country | 2019 | 2020 | 2021 | 2022 | 2023 | 2024 |
| Austria | 1,788,234 | 1,380,487 | 1,518,831 | 1,983,962 | 2,162,267 | 2,245,756 |
| Belgium | 844,047 | 554,079 | 812,249 | 915,986 | 1,000,547 | 1,011,488 |
| Bulgaria | 11,786 | 11,337 | 10,752 | 10,140 | 24,979 | 29,618 |
| Croatia | 2,943,802 | 1,301,220 | 2,599,637 | 3,288,203 | 3,461,724 | 3,433,956 |
| Cyprus | 742 | 0 | 0 | 4,799 | 1,316 | 4,240 |
| Czechia | 1,402,511 | 1,386,891 | 1,329,579 | 1,458,660 | 1,481,391 | 1,552,049 |
| Denmark | 1,370,390 | 1,256,923 | 1,440,575 | 1,587,166 | 1,514,593 | 1,562,289 |
| Estonia | 9,599 | 4,001 | 2,448 | 9,951 | 11,746 | 11,908 |
| Finland | 918,811 | 883,095 | 983,852 | 853,154 | 871,503 | 887,689 |
| France | 25,559,464 | 18,023,538 | 23,530,862 | 30,159,686 | 32,208,772 | 31,775,212 |
| Germany | 11,169,948 | 9,701,407 | 9,125,693 | 12,222,120 | 13,122,974 | 13,546,395 |
| Greece | 475,668 | 208,472 | 286,109 | 415,206 | 471,491 | 486,724 |
| Hungary | 579,705 | 350,805 | 380,113 | 670,173 | 694,366 | 707,188 |
| Ireland | 357,962 | 252,963 | 415,302 | 762,768 | 400,913 | 600,805 |
| Italy | 8,724,883 | 5,291,589 | 7,446,665 | 9,239,458 | 9,486,995 | 9,525,205 |
| Latvia | 109,599 | 83,263 | 86,757 | 105,777 | 109,753 | 123,930 |
| Lithuania | 65,259 | 41,666 | 61,258 | 69,851 | 94,971 | 56,238 |
| Luxembourg | 219,208 | 121,560 | 178,118 | 265,234 | 287,363 | 334,002 |
| Malta | 0 | 0 | 0 | 0 | 0 | 0 |
| Netherlands | 4,263,670 | 3,547,187 | 4,370,806 | 5,026,426 | 5,158,037 | 5,197,510 |
| Poland | 415,662 | 321,619 | 335,446 | 341,764 | 361,843 | 432,983 |
| Portugal | 1,733,883 | 986,047 | 1,191,067 | 1,818,452 | 1,896,405 | 1,870,109 |
| Romania | 111,106 | N/A | 84,350 | 97,363 | 109,235 | 136,575 |
| Slovakia | 130,054 | 111,751 | 92,550 | 119,590 | 142,022 | 156,941 |
| Slovenia | 713,912 | 450,474 | 602,328 | 821,964 | 790,786 | 834,249 |
| Spain | 8,304,822 | 4,492,253 | 7,621,770 | 9,440,018 | 10,016,337 | 10,198,613 |
| Sweden | 6,047,561 | 4,358,208 | 5,400,691 | 6,275,920 | 6,308,690 | 6,406,870 |
| European Union - 27 countries | 78,272,288 | 55,212,022 | 69,907,808 | 87,963,791 | 92,191,019 | 93,128,542 |
Source · Eurostat
| Nights spent at Camping Grounds, Recreational Vehicle Parks and Trailer parks (by International + Domestic Visitors) | ||||||
|---|---|---|---|---|---|---|
| Country | 2019 | 2020 | 2021 | 2022 | 2023 | 2024 |
| Austria | 7,141,286 | 6,001,577 | 6,379,591 | 7,853,302 | 8,329,554 | 8,503,975 |
| Belgium | 3,045,340 | 2,223,897 | 3,045,600 | 3,288,305 | 3,451,572 | 3,387,002 |
| Bulgaria | 75,680 | 73,742 | 84,882 | 69,169 | 128,463 | 141,763 |
| Croatia | 19,173,976 | 9,139,206 | 17,500,753 | 21,397,570 | 21,643,526 | 21,446,680 |
| Cyprus | 2,392 | 0 | 0 | 12,098 | 3,454 | 22,846 |
| Czechia | 3,422,013 | 3,442,673 | 3,375,093 | 3,697,290 | 3,599,823 | 3,745,768 |
| Denmark | 11,036,831 | 10,853,437 | 11,952,357 | 12,751,345 | 12,177,916 | 12,179,670 |
| Estonia | 15,110 | 6,683 | 3,954 | 15,116 | 16,756 | 19,173 |
| Finland | 1,908,989 | 1,732,373 | 1,961,689 | 1,798,849 | 1,771,896 | 1,764,410 |
| France | 128,601,626 | 90,900,614 | 115,561,795 | 141,684,193 | 147,988,263 | 147,849,448 |
| Germany | 35,756,382 | 33,953,049 | 32,937,634 | 40,177,003 | 42,274,696 | 42,861,907 |
| Greece | 2,109,923 | 899,117 | 1,277,883 | 1,839,804 | 2,141,101 | 2,191,364 |
| Hungary | 2,028,014 | 1,106,099 | 1,199,500 | 1,955,928 | 1,974,404 | 2,012,083 |
| Ireland | 1,580,501 | 1,036,201 | 1,476,868 | 2,734,349 | 2,030,930 | 2,905,879 |
| Italy | 54,598,600 | 31,216,993 | 45,554,138 | 55,050,851 | 55,145,552 | 54,636,497 |
| Latvia | 166,923 | 128,492 | 127,833 | 157,356 | 171,949 | 181,560 |
| Lithuania | 138,555 | 70,590 | 136,382 | 116,007 | 237,742 | 96,396 |
| Luxembourg | 982,435 | 668,220 | 904,965 | 1,204,985 | 1,301,117 | 1,363,683 |
| Malta | 0 | 0 | 0 | 0 | 0 | 0 |
| Netherlands | 21,874,729 | 20,648,123 | 25,410,022 | 26,462,570 | 28,103,407 | 26,084,144 |
| Poland | 1,280,596 | 975,061 | 1,085,276 | 1,144,144 | 1,120,061 | 1,336,899 |
| Portugal | 6,941,638 | 4,237,513 | 4,941,876 | 6,763,850 | 7,188,459 | 7,200,893 |
| Romania | 330,640 | 269,527 | 222,946 | 257,450 | 258,229 | 352,211 |
| Slovakia | 323,426 | 263,010 | 218,311 | 296,613 | 350,854 | 374,316 |
| Slovenia | 2,037,068 | 1,419,250 | 1,776,279 | 2,353,004 | 2,248,857 | 2,370,336 |
| Spain | 40,721,460 | 21,569,075 | 34,697,032 | 44,543,506 | 47,076,021 | 49,091,785 |
| Sweden | 16,747,364 | 12,818,862 | 15,456,560 | 17,135,979 | 16,592,664 | 16,737,801 |
| European Union - 27 countries | 362,041,497 | 255,653,384 | 327,289,219 | 394,760,636 | 407,327,266 | 408,858,489 |
Source · Eurostat
| Expenditure (in Euro) at Campsites, Caravans, or Trailer Parks (by European Residents) | ||||||
|---|---|---|---|---|---|---|
| Country | 2019 | 2020 | 2021 | 2022 | 2023 | 2024 |
| Austria | 114,983,829 | 88,568,855 | 131,531,009 | 231,901,713 | 339,482,925 | 401,656,400 |
| Belgium | 163,793,702 | 90,067,837 | 139,818,923 | 148,591,336 | 196,165,180 | 315,352,297 |
| Bulgaria | 3,294,932 | 5,255,630 | 6,860,458 | 5,147,690 | 13,932,116 | 9,163,718 |
| Croatia | 12,210,110 | N/A | 11,240,340 | 13,174,529 | 15,804,434 | 21,263,577 |
| Cyprus | N/A | N/A | N/A | 908,013 | 1,752,602 | N/A |
| Czechia | 60,819,001 | 43,492,330 | 54,452,929 | 85,621,363 | 80,333,547 | 92,876,409 |
| Denmark | 414,415,617 | 136,276,237 | 111,978,500 | 151,055,273 | 197,198,845 | 97,024,405 |
| Estonia | 7,277,235 | 1,813,001 | 5,755,485 | 5,648,511 | 3,845,788 | 5,771,005 |
| Finland | 42,040,476 | 52,229,582 | 36,486,839 | 55,341,968 | 39,812,762 | 50,384,609 |
| France | 2,287,181,224 | 1,889,218,036 | 2,360,378,423 | 2,629,749,487 | 2,334,930,255 | 2,342,658,269 |
| Germany | 1,985,937,798 | 1,103,473,026 | 1,663,116,621 | 2,448,054,697 | 2,237,640,866 | 3,674,451,912 |
| Greece | 7,891,742 | 2,382,592 | 8,823,118 | 10,213,727 | 5,148,243 | 7,029,422 |
| Hungary | 25,096,775 | 13,155,238 | 20,224,265 | 34,968,871 | 32,950,481 | 33,778,864 |
| Ireland | 115,618,396 | 18,717,966 | 28,989,704 | 137,731,661 | 99,316,579 | 206,261,609 |
| Italy | 277,163,631 | 282,201,141 | 267,031,014 | 463,895,417 | 265,108,144 | 270,999,286 |
| Latvia | 10,783,100 | 2,940,476 | 7,501,503 | 5,258,584 | 14,238,539 | 12,229,035 |
| Lithuania | 2,127,914 | 1,583,753 | 2,223,563 | 3,517,853 | 3,578,574 | 2,813,852 |
| Luxembourg | 15,885,073 | 13,016,083 | 14,315,109 | 25,082,242 | 21,284,790 | 30,484,957 |
| Malta | 1,713,900 | N/A | N/A | N/A | 2,956,965 | N/A |
| Netherlands | 257,689,139 | 176,533,606 | 594,684,224 | 726,354,141 | 761,330,465 | 658,743,151 |
| Poland | 79,308,862 | 44,405,283 | 58,893,180 | 86,880,398 | 75,601,775 | 96,234,912 |
| Portugal | 30,012,482 | 16,940,314 | 15,394,221 | 23,441,669 | 31,115,658 | 27,524,522 |
| Romania | 14,188,600 | 7,541,045 | 11,199,507 | 19,039,856 | 22,509,483 | 18,152,272 |
| Slovakia | 7,979,368 | N/A | 8,082,960 | N/A | 12,064,209 | 10,711,757 |
| Slovenia | 39,894,396 | 22,359,308 | 50,375,281 | 52,836,519 | 63,587,881 | 91,496,838 |
| Spain | 372,973,427 | 219,814,098 | 388,116,542 | 490,271,379 | 583,889,835 | 550,867,062 |
| Sweden | 227,149,855 | 210,221,546 | 335,359,694 | 309,007,403 | N/A | 447,001,171 |
| European Union - 27 countries | 6,577,440,409 | 4,452,552,660 | 6,334,024,690 | 8,170,423,388 | 7,808,594,666 | 9,477,324,474 |
Source · Eurostat
References
- Eurostat — Camping accommodation statistics (arrivals, nights spent, expenditure, pandemic impact) · ec.europa.eu
- Mordor Intelligence — Europe Camping and Caravanning Market Outlook · mordorintelligence.com
- Camperguru — European Camping Statistics 2023 · camperguru.com
- UKCCA — 2024 Economic Benefit Report · ukcca.org.uk
- Did camping become more popular in 2020? — Eurostat News · ec.europa.eu
- Thinking of going camping this summer? — Eurostat News · ec.europa.eu
- 2021: 43% of tourism nights spent in July and August — Eurostat News · ec.europa.eu
- European Camping Group · europeancampinggroup.com
- The European camping landscape in 2023 — ACSI · acsi.eu
- EFCO & HPA — Reports · efcohpa.eu
- Camping Market Outlook 2022–2026 — ReportLinker · reportlinker.com
- Nights Spent at Camping Grounds — UK, France, Belgium — ReportLinker · reportlinker.com
- Turnover of Camping Grounds — ReportLinker · reportlinker.com
- Camping Industry Insights, Trends and Forecasts by Country — ReportLinker · reportlinker.com