

Updated
At a Glance
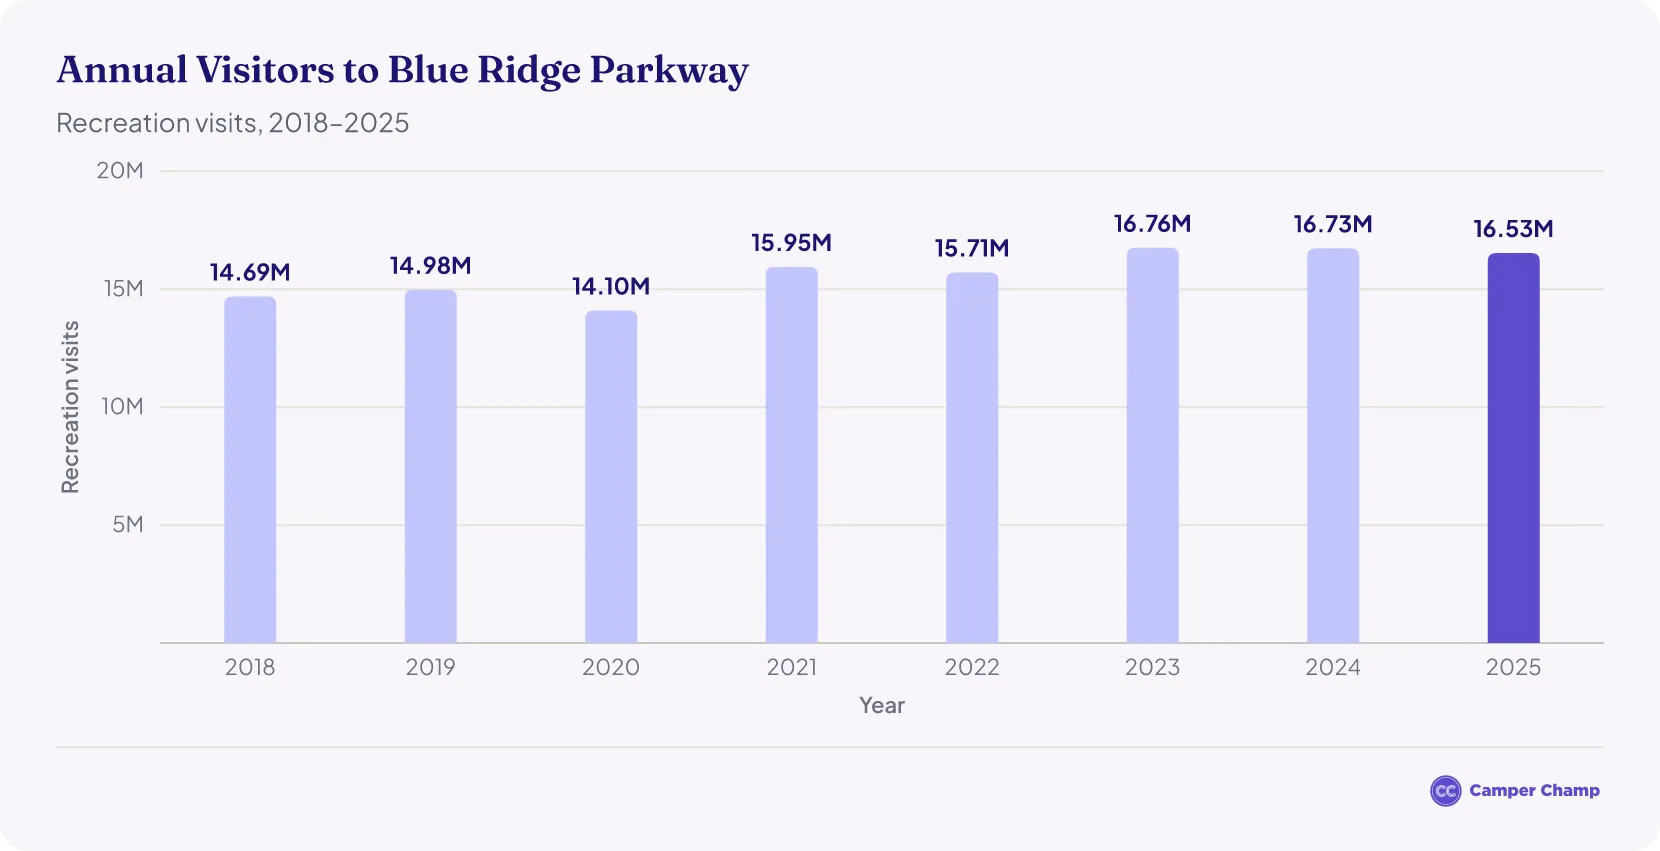
- 16,533,753 people visited Blue Ridge Parkway in 2025, down 1.2% from 2024 and up 10.4% from 2019 (pre-pandemic)1.
- It was the #1 most-visited National Park Service site in 20252.
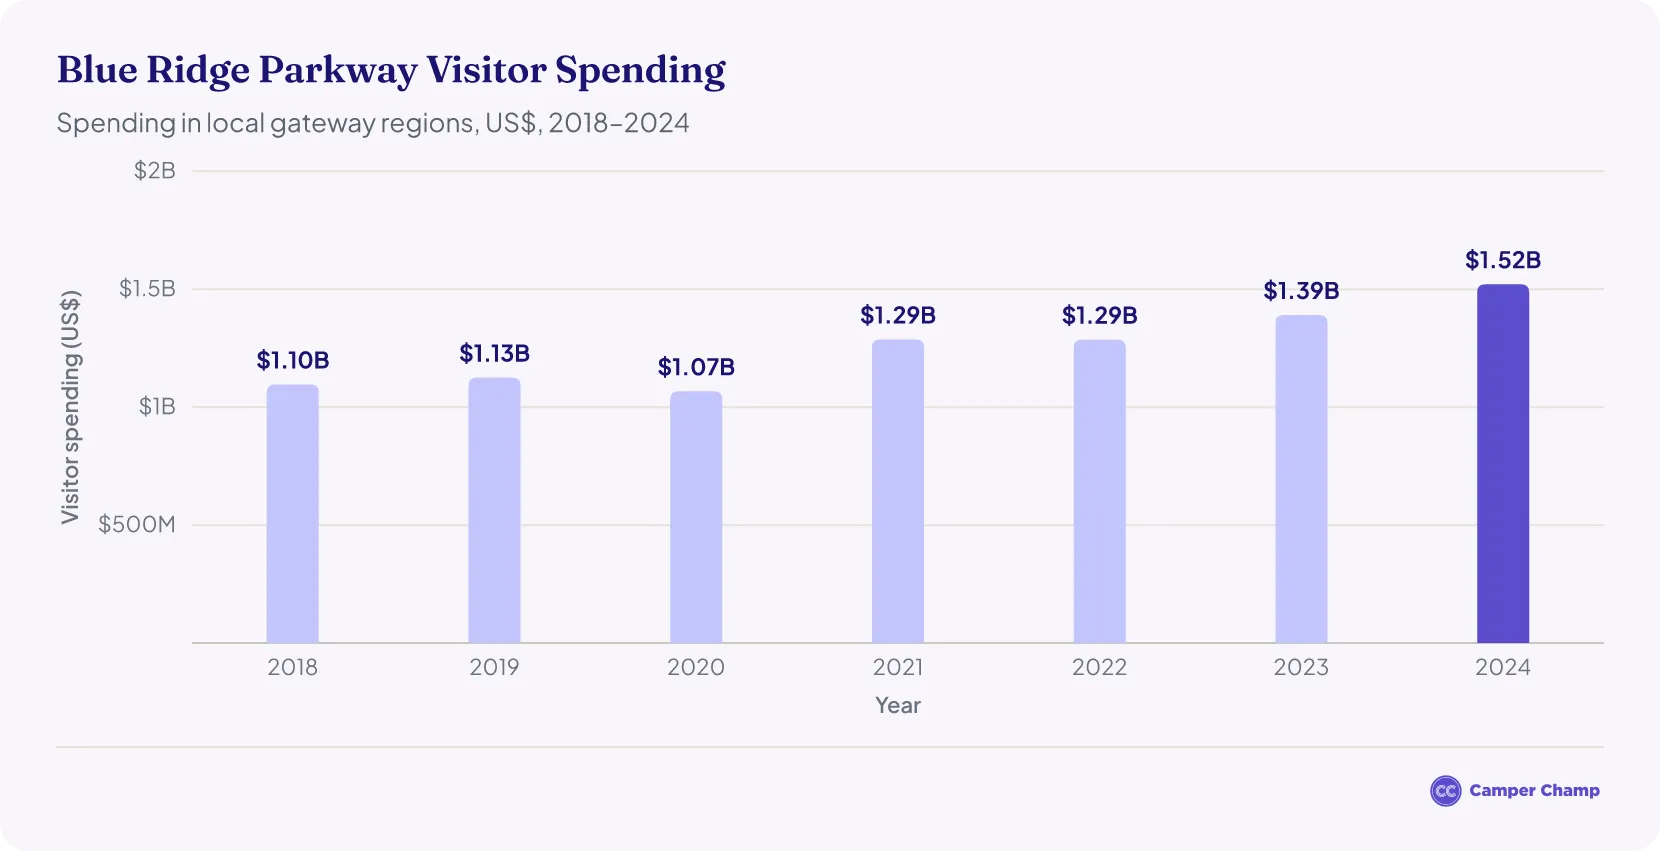
- Visitors spent $1.52 billion in 2024, up 9.4% from 20233.
- About 45,000 people visit each day1, with more in summer and fall.
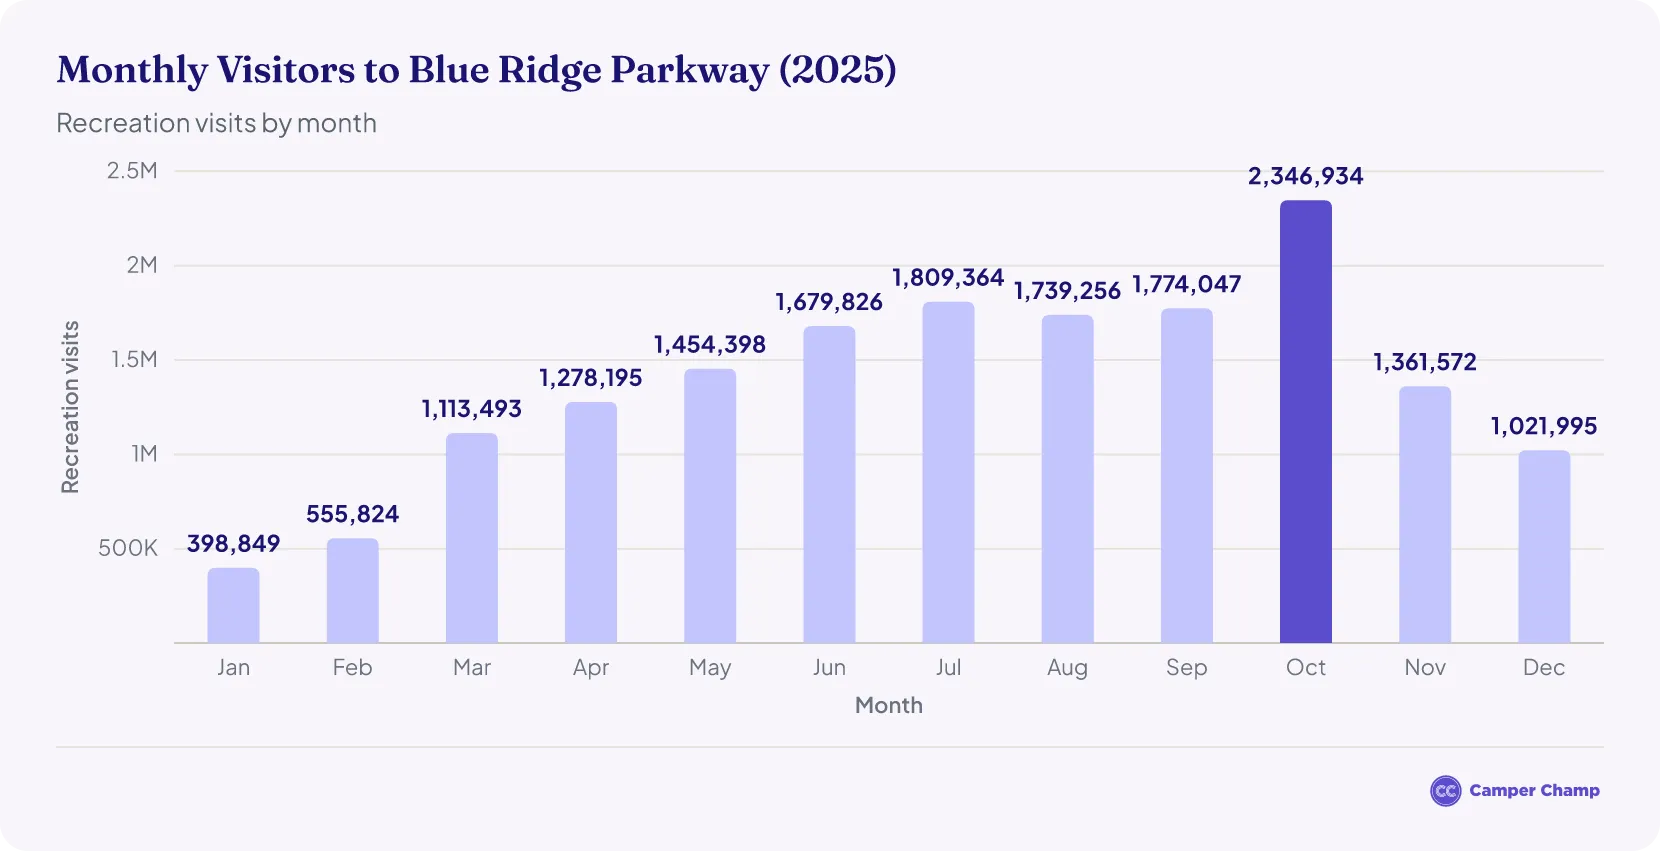
- October was the busiest month of 2025, with 2.35 million visitors4.
- From January to July 2026, 9.97 million people visited, up 20.3% on the same months of 2025 (provisional counts)4.
- Entry is free5, and the scenic route runs for 469 miles6.
How many people visit Blue Ridge Parkway each year?
Blue Ridge Parkway now draws over 16 million visitors a year, and annual totals have stayed above 16.5 million since 20231. That is still about 23% below the record 21.5 million visits in 2002.
Totals in recent years:
- 16,533,753 visitors in 2025, down 1.2% from 2024 and up 10.4% from 20191. October was the busiest month, with 2.35 million visits4.
- 16,733,639 visitors in 20241, almost unchanged from 2023 (down 0.1%).
- 16,757,635 visitors in 2023, up 6.7% from 20221, the most in any year since 2007.
- 15,711,004 visitors in 2022, down 1.5% from 2021 (15,948,148 visitors)1. That 2021 total was up 13.1% on 2020 as visits rebounded after the pandemic.
- 14,976,085 visitors in 20191, up 1.9% from 2018. Visits then fell 5.9% to 14,099,485 in 2020 as the pandemic hit.
How many people have visited Blue Ridge Parkway in 2026 so far?
- From January to July 2026, 9.97 million people visited Blue Ridge Parkway, up 20.3% from the same months of 20254 (provisional NPS counts).
July 2026 is the latest month available: the National Park Service had not published August or September figures as of October 30, 2026.
| Blue Ridge Parkway Visitors by Month (2026) | |
|---|---|
| Month | Recreation Visits |
| Jan | 937,2644 |
| Feb | 883,8994 |
| Mar | 1,278,5724 |
| Apr | 1,476,9094 |
| May | 1,676,3424 |
| Jun | 1,859,5794 |
| Jul | 1,858,3954 |
Source · 2026 figures are preliminary and subject to change.
How much do visitors spend each year at Blue Ridge Parkway?
What is the economic impact of Blue Ridge Parkway?
Visitor spending at Blue Ridge Parkway generated $1.88 billion in economic output in local gateway regions in 20243. It supported:
Visitors from outside the area spent $1.44 billion of the $1.52 billion total3.
The figures are National Park Service Visitor Spending Effects estimates, and 2024 is the latest year available.
How many people visit Blue Ridge Parkway per day?
How much does it cost to visit Blue Ridge Parkway?
- Blue Ridge Parkway is free to visit: there is no entrance fee at this national park site5.
When is Blue Ridge Parkway’s peak season?
Blue Ridge Parkway’s peak season runs from late spring to fall.
- October was the busiest month in 2025, with 2.35 million visitors4. June through September each drew about 1.7–1.8 million visitors.
- Summer and fall are the busiest seasons, when the weather is best for getting outdoors.
What are the best months to visit Blue Ridge Parkway?
The best months to visit are April and May, when wildflowers bloom, temperatures are mild and crowds are smaller. In 2025 they drew 1.28 million and 1.45 million visitors, roughly 38–46% fewer than October (2.35 million)4.
- Summer (June–July): Warm weather that suits hiking and camping, but also one of the busiest times of year.
- Fall (September–October): The most popular time to visit, when the leaves change color.
- Winter (December–February): The quietest months, with just 398,849 visitors in January 20254, though snow sometimes closes parts of the road.
Is Blue Ridge Parkway the most visited national park site?
Yes. Blue Ridge Parkway was the most-visited National Park Service site in 2025, ahead of Golden Gate National Recreation Area and Great Smoky Mountains National Park2. It is consistently among the most visited parks in the United States.
| Top 10 Most-Visited National Park Service Sites (2025) | ||
|---|---|---|
| Rank | Park | Recreation Visits |
| 1 | Blue Ridge Parkway | 16,533,7532 |
| 2 | Golden Gate National Recreation Area | 15,748,6762 |
| 3 | Great Smoky Mountains National Park | 11,527,9392 |
| 4 | Natchez Trace Parkway | 7,994,7832 |
| 5 | Lincoln Memorial | 7,743,2952 |
| 6 | Gateway National Recreation Area | 7,696,9392 |
| 7 | Gulf Islands National Seashore | 7,576,9232 |
| 8 | George Washington Memorial Parkway | 6,732,9322 |
| 9 | Appalachian National Scenic Trail | 6,215,1182 |
| 10 | Lake Mead National Recreation Area | 6,135,5862 |
Why do people visit Blue Ridge Parkway?
People come to the Blue Ridge Parkway for:
- Hiking and outdoor activities at Humpback Rocks, Linville Falls and Craggy Gardens
- Plenty of camping options, from RV sites to backcountry
- Wildlife watching and nature photography
- Historic sites, visitor centers and Appalachian heritage exhibits
Camping Statistics for Blue Ridge Parkway in 2025 and 2026
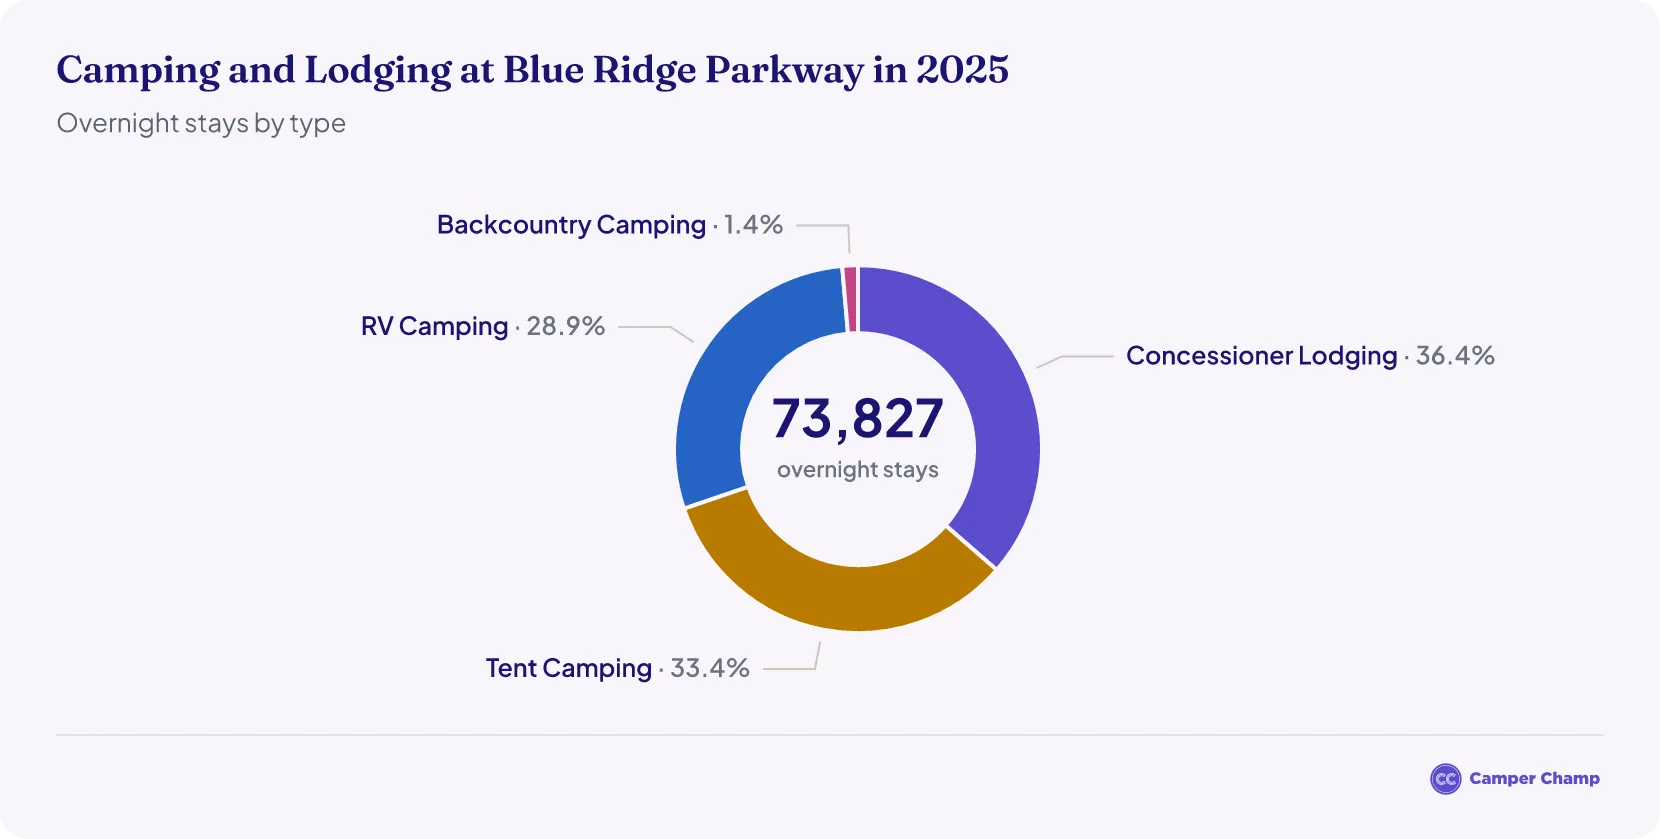
Tent camping was the most popular way to camp at Blue Ridge Parkway in 2025, with 24,628 overnight stays8. RV Camping followed, with 21,309 overnight stays.
Other overnight stays in 2025:
- Concessioner Lodging: 26,876 overnight stays, more than any type of camping8
- Backcountry Camping: 1,014 overnight stays8
Overnight stays from January to July 2026 (provisional), compared with the same months of 2025:
- Total: 40,869 overnight stays, up 33.8%9
- Concessioner Lodging: 15,812 overnight stays, up 22.4%9
- Tent Camping: 15,182 overnight stays, up 55.7%9
- RV Camping: 9,503 overnight stays, up 30.6%9
- Backcountry Camping: 372 overnight stays, down 38.3%9
For the bigger picture, see our camping statistics for the USA.
RV rental in the USA
How many people have died on the Blue Ridge Parkway?
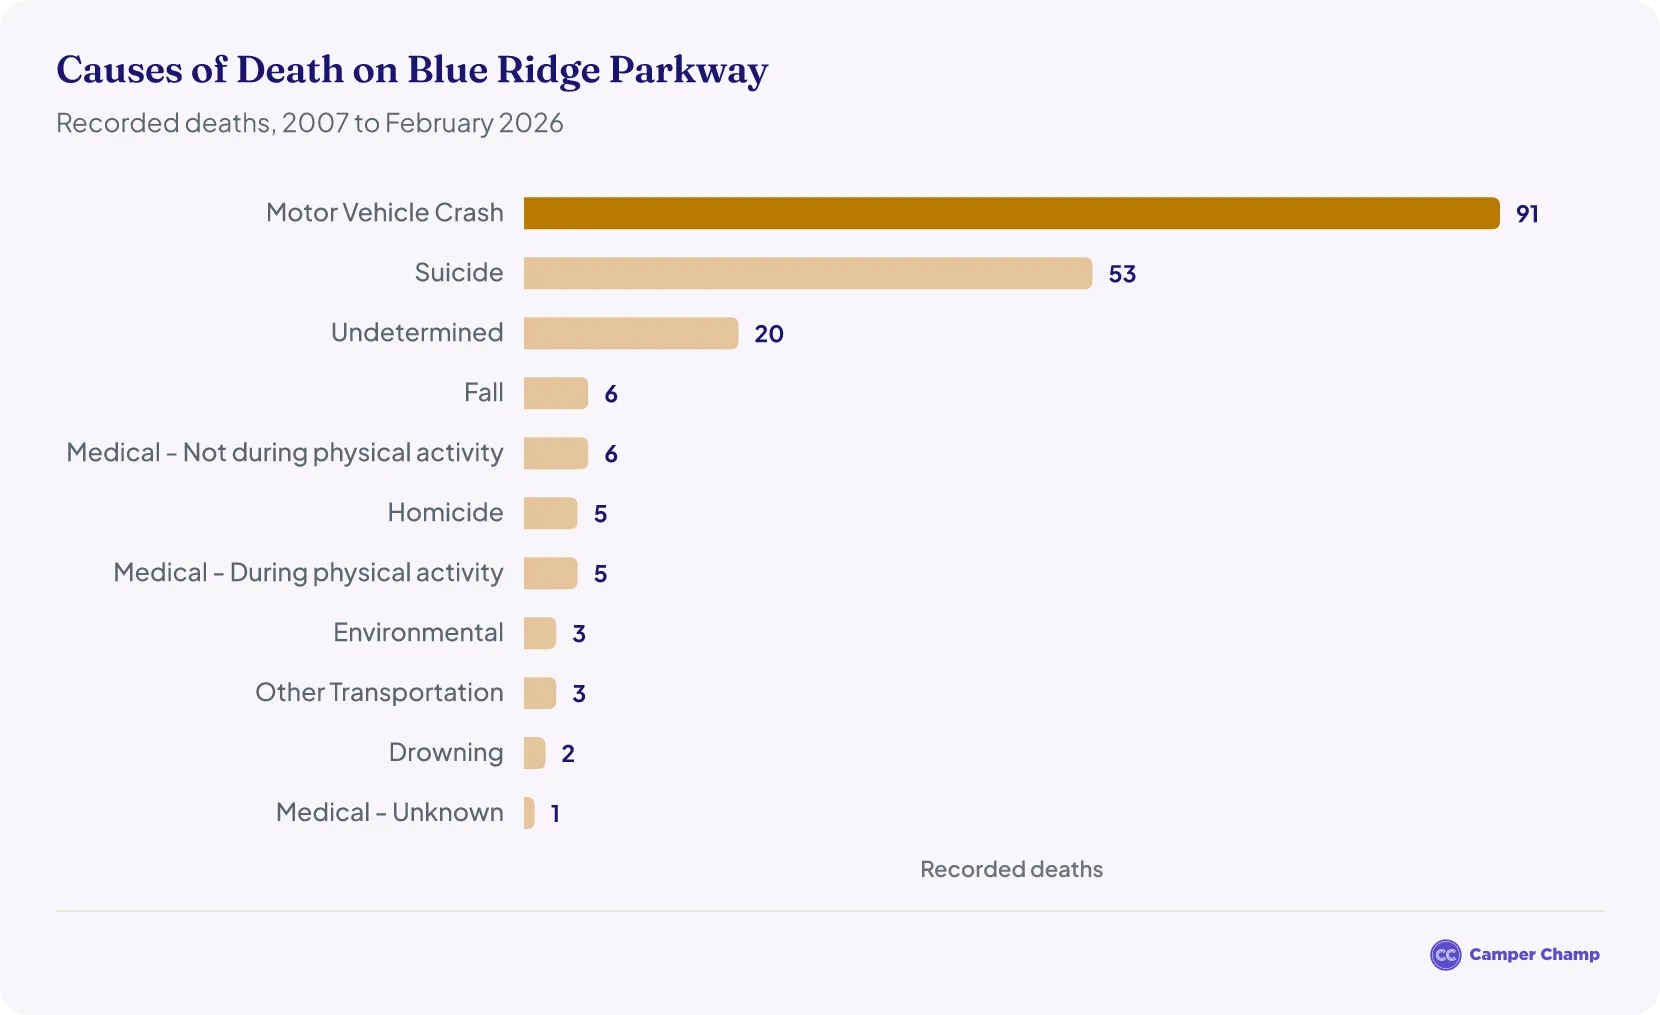
From 2007 to February 2026, 195 deaths were recorded10 at Blue Ridge Parkway. By cause:
- Motor Vehicle Crashes: 91 deaths10
- Suicide: 53 deaths10
- Undetermined Causes: 20 deaths10
- Falls: 6 deaths10
- Medical (Not During Physical Activity): 6 deaths10
- Homicide: 5 deaths10
- Medical (During Physical Activity): 5 deaths10
- Environmental Factors: 3 deaths10
- Other Transportation Accidents: 3 deaths10
- Drowning: 2 deaths10
- Medical (Unknown): 1 death10
NPS only recorded unintentional deaths before 2014, and counts from 2020 onward are provisional10.
Safety Tips for Visiting Blue Ridge Parkway
When you’re at Blue Ridge Parkway, don’t forget to:
- Drive safe and watch for wildlife and curves: motor vehicle crashes cause more deaths on the parkway than anything else10.
- Plan for the weather, which can change fast in the mountains.
- Be prepared when hiking by carrying water, wearing good shoes and telling someone where you’re going.
- Watch out for wildlife and don’t feed or approach animals.
- Stay on marked trails so you don’t fall or get lost.
- Save the park rangers’ phone numbers so you can call them in an emergency.
FAQs
Is the Blue Ridge Parkway a national park?
Not technically. It's a parkway run by the National Park Service, not a designated national park, but in 2025 it was the most-visited National Park Service site, with 16,533,753 visitors, ahead of Golden Gate National Recreation Area (15,748,676) and Great Smoky Mountains National Park (11,527,939)2.
How long is the Blue Ridge Parkway?
The parkway is 469 miles long6.
Does the Blue Ridge Parkway get more visitors now than before the pandemic?
Yes. 16,533,753 people visited in 2025, 10.4% more than the 14,976,085 who visited in 20191. Visits fell to 14,099,485 in 2020 during the pandemic.
Can you drive the Blue Ridge Parkway in winter?
Yes, but December to February is the quietest time of year and snow can close parts of the road, so check conditions before you set out.
What is the biggest safety risk on the Blue Ridge Parkway?
Driving. Motor vehicle crashes caused 91 of the 195 deaths recorded from 2007 to February 202610, more than any other cause. Watch for curves and wildlife, and allow for fast-changing mountain weather.
More National Park Service Site Statistics
- Cape Cod National Seashore Tourism Statistics
- Castle Clinton National Monument Tourism Statistics
- Chattahoochee River National Recreation Area Tourism Statistics
- Chesapeake & Ohio Canal National Historical Park Tourism Statistics
- Franklin Delano Roosevelt Memorial Tourism Statistics
- Gateway National Recreation Area Tourism Statistics
- Gulf Islands National Seashore Tourism Statistics
- Korean War Veterans Memorial Tourism Statistics
- Lincoln Memorial Tourism Statistics
- Martin Luther King, Jr. Memorial Tourism Statistics
- Natchez Trace Parkway Tourism Statistics
- Vietnam Veterans Memorial Tourism Statistics
References
- NPS Visitor Use Statistics — Annual Park Recreation Visitation (1904 - Last Calendar Year), Blue Ridge Parkway · irma.nps.gov ↑ b c d e f g h i j
- National Park Service Records More Than 323 Million Recreation Visits in 2025 (NPS news release, 13 March 2026) · nps.gov ↑ b c d e f g h i j k l m n o
- NPS Visitor Spending Effects — park results, Blue Ridge Parkway (BLRI), 2012–2024 · irmaservices.nps.gov ↑ b c d e f g h i j
- NPS Visitor Use Statistics — Recreation Visitors By Month (1979 - Last Calendar Year), Blue Ridge Parkway · irma.nps.gov ↑ b c d e f g h i j k l m n o p
- Fees & Passes - Blue Ridge Parkway (U.S. National Park Service) · nps.gov ↑ b
- Blue Ridge Parkway (U.S. National Park Service) · nps.gov ↑ b c
- 2023 National Park Visitor Spending Effects: Economic Contributions to Local Communities, States, and the Nation (NPS Science Report NPS/SR—2024/174) · nps.gov ↑
- NPS Visitor Use Statistics — Overnight Stays (1979 - Last Calendar Year), Blue Ridge Parkway · irma.nps.gov ↑ b c
- NPS Visitor Use Statistics — Park YTD Version 2, Blue Ridge Parkway · irma.nps.gov ↑ b c d e
- NPS Mortality Data, CY2007 onward (Prevention and Response Branch FOIA release) · nps.gov ↑ b c d e f g h i j k l m n o
- National Park Annual Visitation · irma.nps.gov