

Published
The United States has one of the world's largest recreational vehicle (RV) markets. The key numbers:
- 8.1 million U.S. households own an RV, and 16.9 million are interested in buying one within the next five years1.
- The median RV owner is 49 years old, and owners use their RV a median of 30 days a year1.
- Manufacturers shipped 342,220 new RVs in 2025, up 2.5% on 20242.
- About 3,100 RV dealer locations operated across the country in 20243.
How many U.S. households own an RV or campervan?
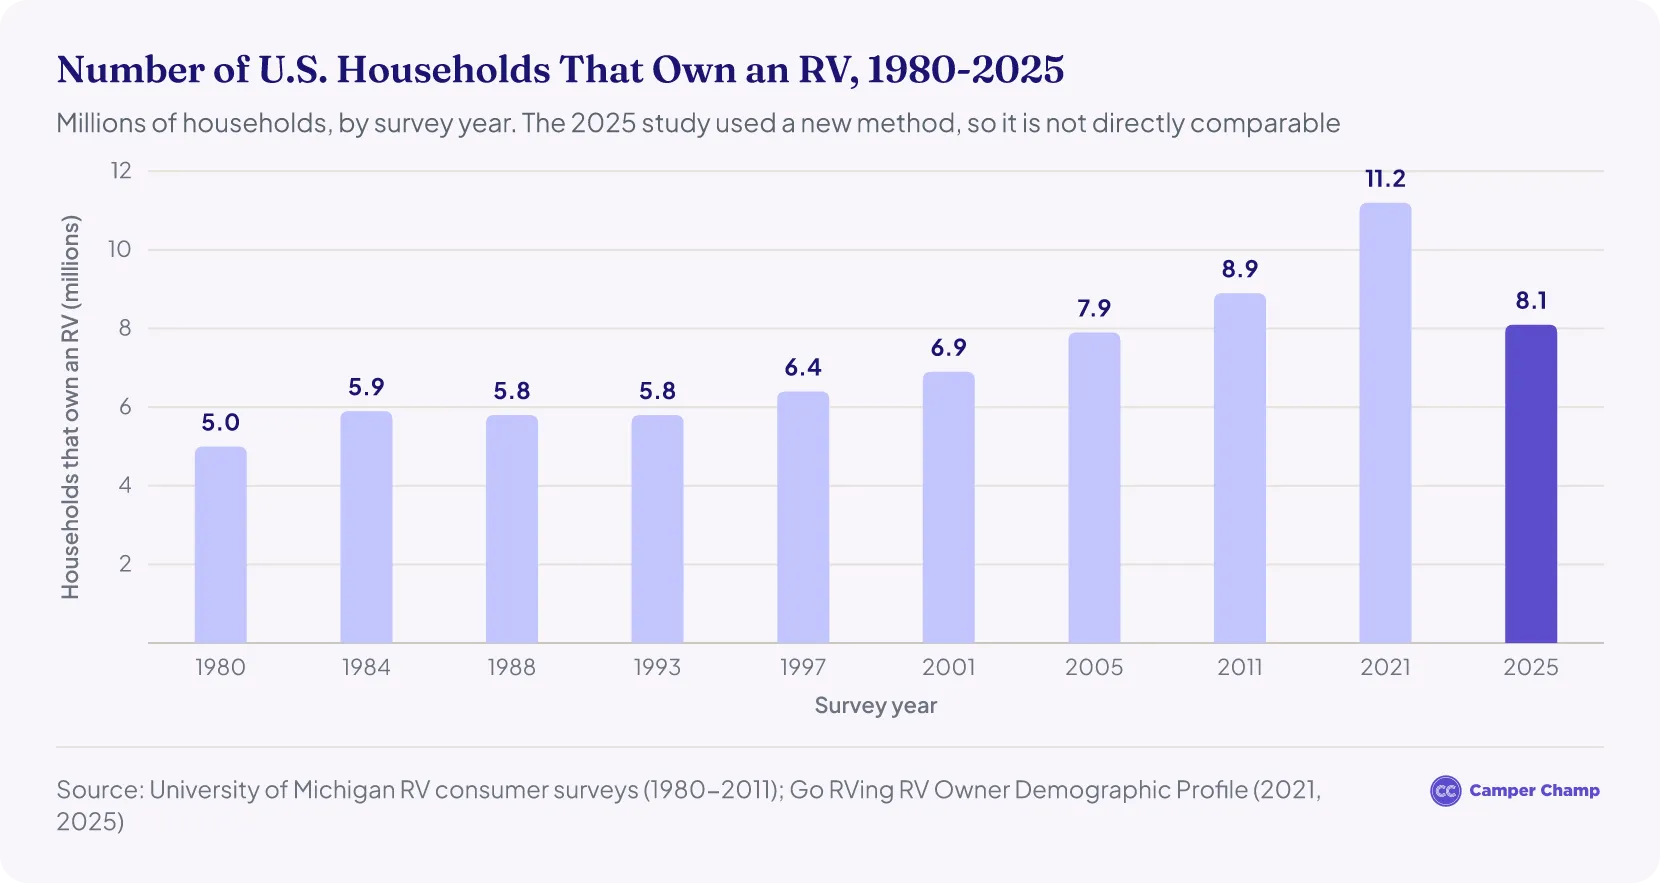
How many RVs are there in the U.S.?
No U.S. agency publishes a count of all RVs on the road. The closest measures are the 8.1 million RV-owning households above and the number of new RVs registered each year:
How many Americans want to buy an RV?
About 16.9 million U.S. households are interested in owning an RV within the next five years1, more than twice the 8.1 million that own one now, according to the 2025 Go RVing owner study.
How many RVs are sold each year in the United States?
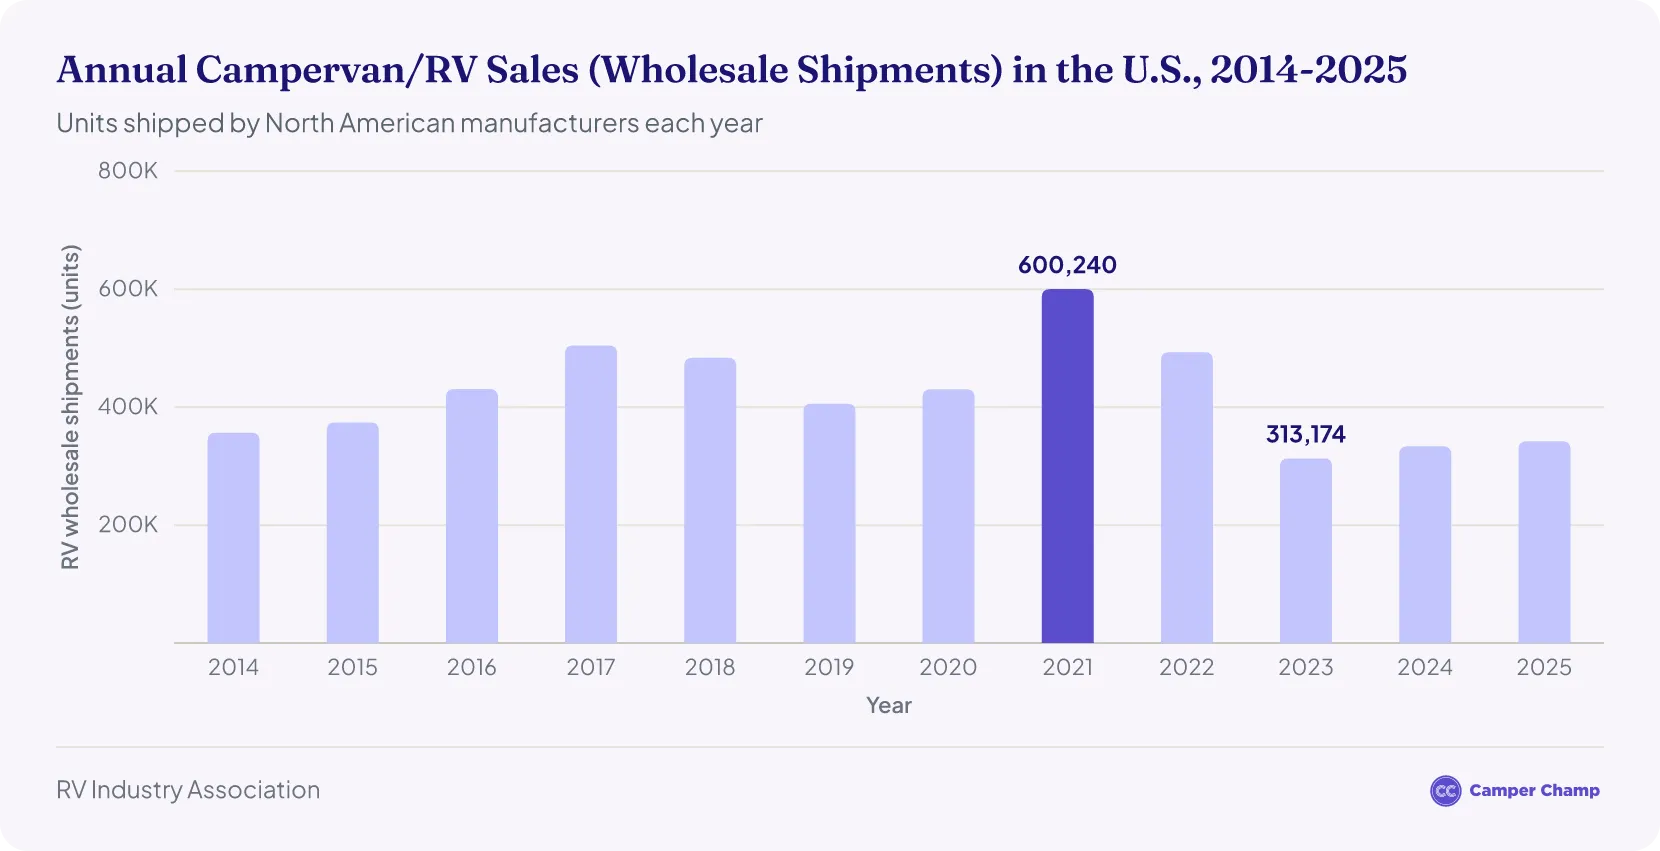
Annual RV sales (wholesale shipments) totaled 342,220 in 2025, up 2.5%2 from 333,733 in 20249, with sales averaging about 422,000 units a year over 2014-202510.
- Manufacturers shipped 356,735 new RVs in 2014.10 Sales steadily increased to 504,599 units in 2017, marking the highest pre-pandemic record11.
- After falling about 20% over 2018-2019, sales grew again to 430,412 units in 2020 as the pandemic began11.
- The industry reached an all-time record of 600,240 units shipped in 2021, representing a 39.5% increase from 2020 figures11.
- Sales normalized to 493,268 units in 2022, still the third-highest year on record12.
- A significant decrease occurred in 2023, with 313,174 units shipped, representing a 36.5% drop from 202213.
- The market showed signs of stabilization in 2024 with 333,733 units shipped, a 6.6% increase from 20239.
- Shipments rose again in 2025 to 342,220 units, a 2.5% increase over 2024, as fifth-wheel shipments jumped 21.6%2.
Which U.S. states buy the most RVs?
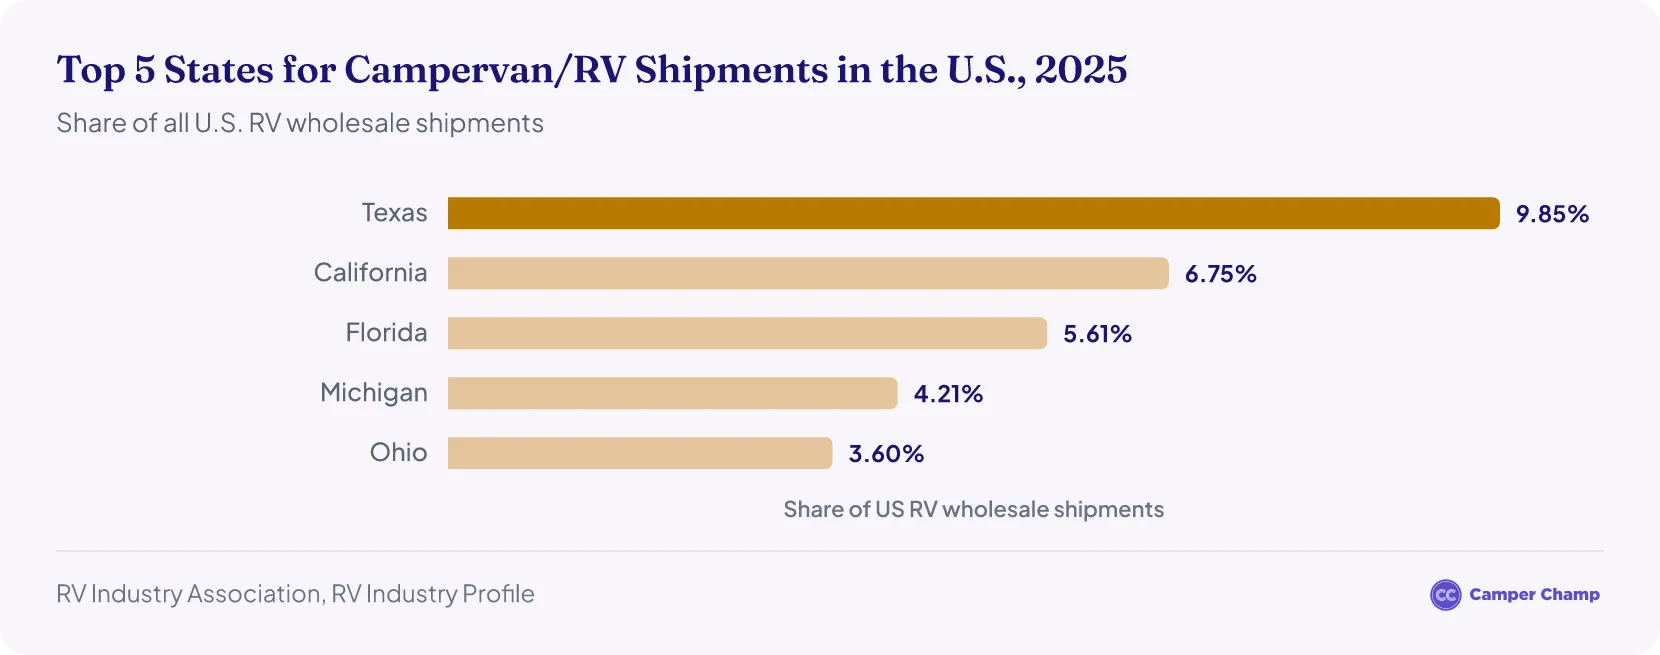
Texas received the highest share of RV shipments in 2025, with 9.85% of all U.S. RV wholesale shipments14, representing around 33,700 new units in 2025.
- California ranks second with 6.75% of national shipments.14 Florida follows with 5.61% of shipments.
- Michigan (4.21%) and Ohio (3.60%) round out the top five, equating to roughly 14,400 and 12,300 units in 202514.
- Most of those RVs are built in Indiana, home to about 88% of RV manufacturing in the U.S. and Canada14.
Who owns an RV in the U.S.? Age, income and family demographics
What is the average age of RV and campervan owners in the U.S.?
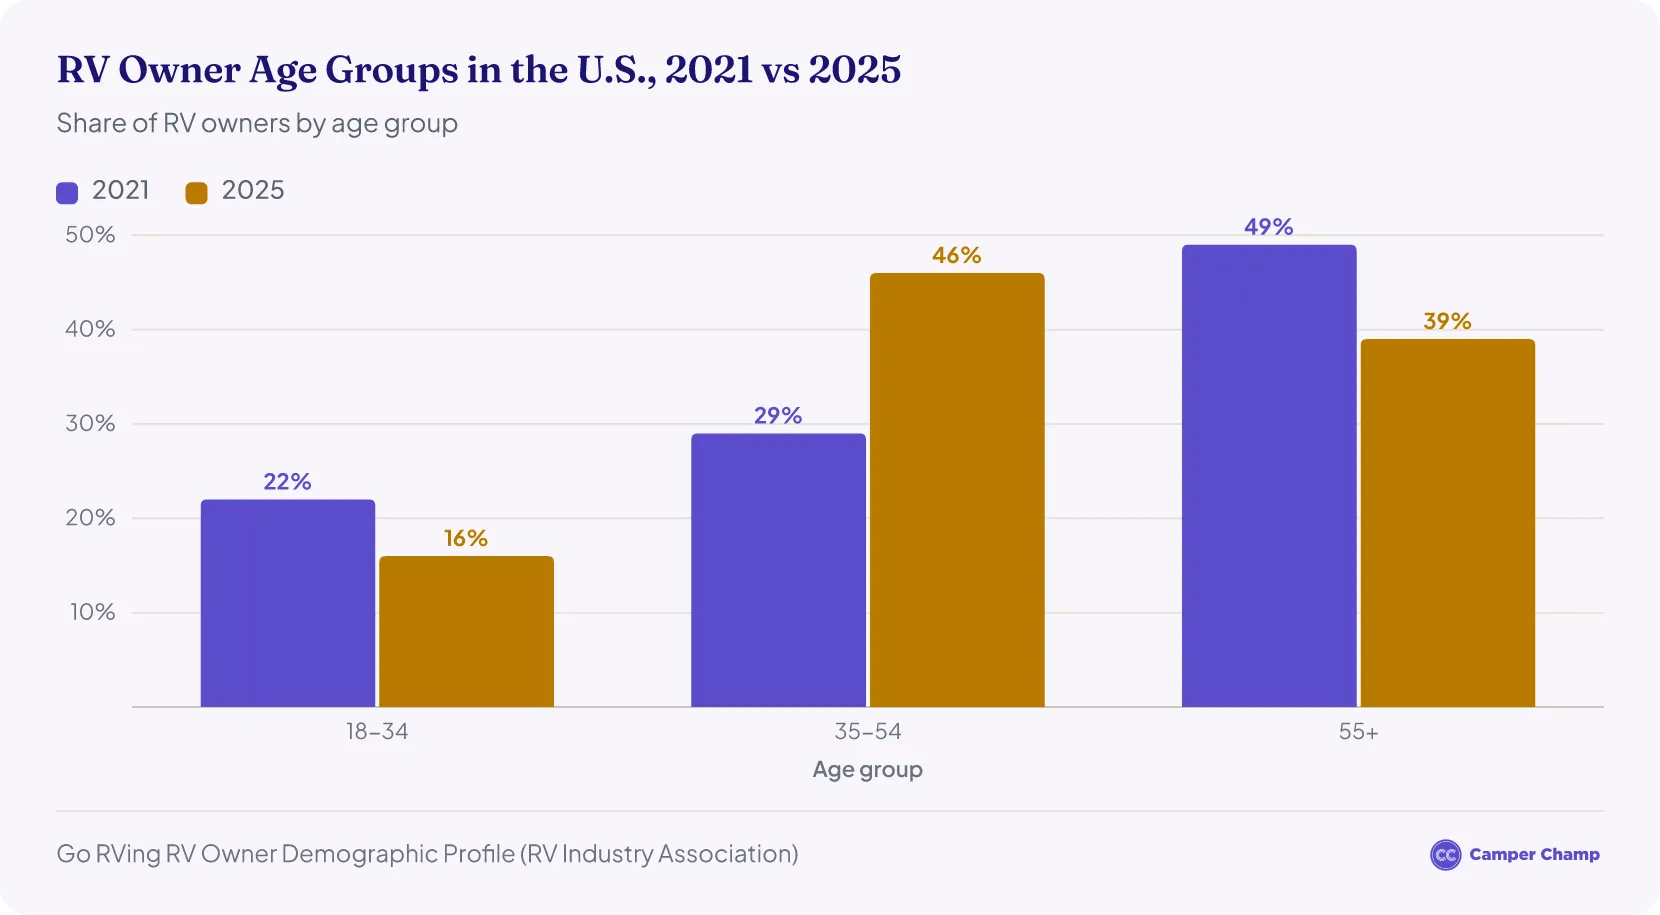
The median age of RV owners in the U.S. is 49, down from 53 in 2021, according to the 2025 Go RVing owner study1.
- Owners aged 55 and over made up 39% of RV owners in 20254, down from 49% in 2021.15
- Owners aged 18-34 made up 16% of RV owners in 20258, down from 22% in 20215.
- The largest single age segment is now middle-aged adults (35-54), accounting for 46% of RV owners in 20251.
- While retirees were historically the primary RV demographic, newcomers are reshaping the market: 36% of owners in 2025 were first-time owners, up from 31% in 20218.
How long do people typically own their RVs or campervans in the U.S.?
Owners typically keep an RV for about six to seven years: the University of Michigan found current owners had owned their RV for an average of 6.6 years in 2005, down from 7.4 years in 200116.
- Nearly one in four owners had kept their current RV for ten years or longer in both the 2005 and 2001 surveys16.
- The median RV in use was 10.8 years old in 2005, down from 14.4 years in 200116, indicating many owners maintain their vehicles for extended periods.
- 69% of current RV owners are somewhat or very likely to buy another RV, up from 68% in 2021, and 70% of repeat buyers kept their previous RV for five years or less8.
- In 2025, 33% of owners had owned an RV for 3-5 years and 22% for two years or less; 55% became RV owners within the past five years8.
What is the average income of RV owners in the United States?
The largest group of RV-owning households earns between $50,000 and $100,000 a year: 43% fall in that range, 34% earn more than $100,000 and 23% less than $50,000, according to the 2025 owner study8.
- 43% of RV owners have children under 18 at home, up from 34% in 20211, though empty-nesters and retirees also form a significant portion of the market.
What percentage of American RV owners live in their vehicles full time?
There is no official count of Americans who live in an RV year-round; the closest measure comes from the 2025 owner study.
- About 6% of owners are "Long Haulers" who use their RV a median of 365 days a year, meaning full-time or close to it, according to the 2025 owner study8.
How many people can travel or live in a typical RV or campervan?
Most RVs comfortably sleep 2-6 people depending on their size and design.
- Smaller Class B campervans typically sleep up to 4 people.
- Class A motorhomes (bus-style) can sleep up to 8 people in larger models17.
- The average RV travel party consists of 2-4 people, typically a family unit or couple.
- 43% of RV owners say being able to bring a pet is a key reason they own an RV1, making RVs a popular pet-friendly travel option.
- The typical RV owner uses their vehicle for a median of about 30 days a year in 2025, just over four weeks, up from 20 days in 20211.
- The typical owner takes about 9 RV trips a year, with a median trip distance of 250 miles8.
RV Types, Prices, and Cost of Ownership in the U.S.
What are the most popular types of campervans and RVs in the U.S.?
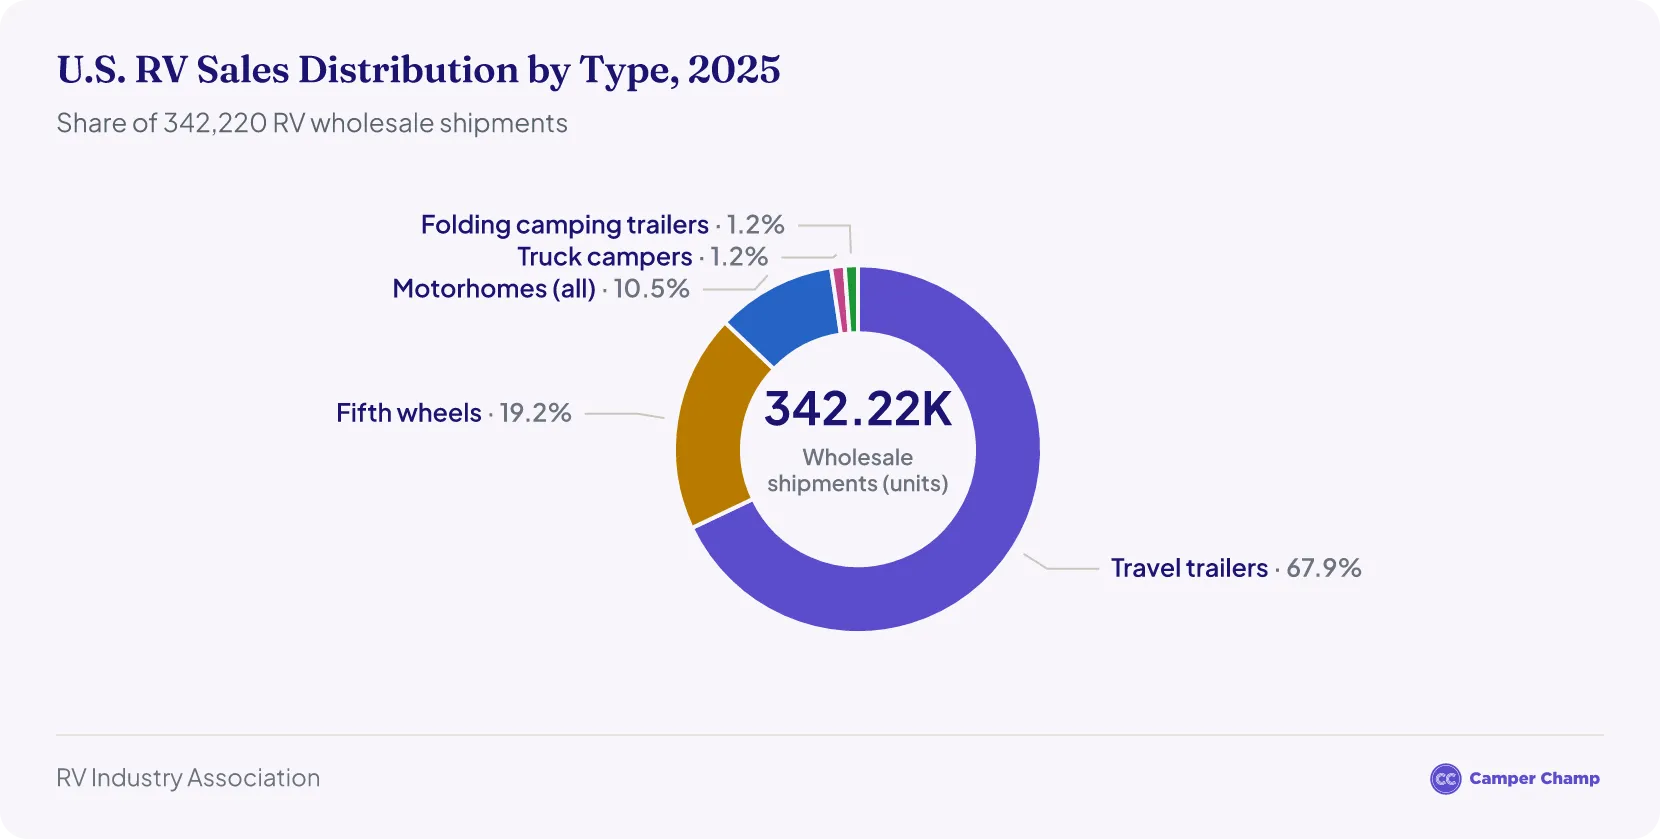
Towable RVs accounted for 89.5% of all RVs shipped in the U.S. in 2025, while motorized RVs represented about 10.5%2.
- Travel trailers are the single most popular RV type, making up about 67.9% of units shipped (232,530 units in 2025)2.
- Fifth-wheel trailers account for roughly 19.2% of the market (65,632 units in 2025)2.
- Motorhomes (Classes A, B, and C combined) represent approximately 10.5% of shipments (36,029 units in 2025)2.
- Among current owners, 65% own a conventional travel trailer, 17% a fifth wheel and 10% a Class C motorhome; towables make up about 83% of the RVs owners use most often, according to the 2025 owner study8.
How much does it cost to purchase a campervan or RV in the U.S.?
Travel trailers average $20,000-$35,000, while small expandable trailers average $10,000-$20,000 and teardrop trailers $15,000-$30,00017, according to Go RVing, the RV industry's consumer site.
- Fifth-wheel trailers average $40,000-$65,00017.
- Class C motorhomes (built on van/truck chassis) average $65,000-$140,00017.
- Class B campervans average $100,000-$150,00017 despite their smaller size, due to specialized conversion features.
- Class A motorhomes (bus-style) average $75,000-$250,00017.
- Used RVs sell for substantially less than new models.
- The median owner paid $27,000 for their current RV8; 71% bought new, and 45% paid cash, while 27% used dealer financing and 20% private financing1.
What does it cost to own an RV each year?
No reliable source publishes a typical yearly cost of owning an RV; it depends mainly on the RV's type and value, how much it is used and where it is stored. The main costs are:
- Maintenance for routine upkeep, which rises with the RV's age and use.
- Insurance costs range from a few hundred to over a thousand dollars annually, depending on the vehicle's value and usage patterns.
- Storage fees where an RV can't be kept at home, which vary widely by location and by outdoor, covered or indoor storage.
- Fuel costs represent a significant variable expense, particularly for motorhomes (large motorhomes use far more fuel per mile than a car).
- Depreciation is substantial, with new RVs losing value fastest in their first few years.
What are the pros and cons of owning an RV versus renting one?
Owning suits people who travel often: they can use the RV on their own schedule, customize it and take long trips, and the cost per trip falls the more they use it. The trade-offs are the upfront price, depreciation, and maintenance and storage costs while it sits idle.
Renting suits occasional travelers: they pay only when they travel, can try different RV types and avoid maintenance and storage, but face limited availability in peak season and higher costs on long trips.
Many owners now use peer-to-peer rental platforms to offset costs by renting their RVs when not in use, creating a middle ground between traditional ownership and rental models.
Learn more about Peer to Peer Rental in the U.S.
RV Dealerships, Manufacturing, and Market Size in the United States
How many RV dealers are there in the United States?
About 3,100 RV dealer locations operated across the United States in 2024 (3,124 private establishments)3, according to the U.S. Bureau of Labor Statistics.
- The number of dealer locations has grown from 2,448 in 201418 to 3,124 in 20243.
- These dealers employed an average of 52,453 workers in 20243, up from 35,299 in 201418, in sales, service and support roles.
- Large dealer groups like Camping World, Lazydays, and General RV have acquired smaller stores in recent years, driving consolidation.
- Dealership distribution mirrors RV demand, with states like Texas, Florida, and California having more than 250 dealer locations each in 20243.
Other Resources
United States RV Use in Travel and Tourism
How many people travel in campervans or RVs each year in the U.S.?
About 23 million Americans planned RV camping or other RV trips in fall 2026 alone, according to an RV Industry Association survey, including more than 9.4 million who don't own an RV and planned to rent or borrow one19.
- About 16 million Americans planned to go RVing over Labor Day weekend in 2023, according to an RV Industry Association survey.20
How many RV parks and campgrounds operate in the U.S.?
There are more than 18,000 public and privately owned campgrounds nationwide21, according to the RV Industry Association's 2019 fact sheet.
- 5,629 privately run RV parks and campgrounds with paid staff operated in 202422, according to the U.S. Bureau of Labor Statistics.
- Facilities range from rustic camps with no hookups to luxury RV resorts with pools and Wi-Fi.
- Michigan had 224 of these private RV parks and campgrounds in 202422.
- Campground occupancy has been strong in recent years, with many popular parks fully booked during peak seasons.
- Alternative overnight options include Walmart parking lots, highway rest stops, and programs like "Harvest Hosts" that allow self-contained RVs to stay at farms and wineries.
What are the most popular RV travel routes and destinations in the U.S.?
RV travelers gravitate toward national parks and scenic routes:
- National parks and scenic wonders overtook beaches in 2026 as the most common destinations for fall RV trips, and more than 90% of RV travelers plan trips within three to seven hours of home19.
- Yellowstone, Yosemite, Zion, and Great Smoky Mountains national parks are among the most visited by RVers.
- Classic routes like Route 66, the Pacific Coast Highway, and the Blue Ridge Parkway attract many RV road-trippers.
For more on where and how Americans camp, see our RV camping statistics.
Alternative Ownership and Lifestyle Trends
What is campervan shared ownership and how does it work?
Peer-to-peer RV rental platforms like RVshare and Outdoorsy allow owners to rent their vehicles to others when not in use.
- Some companies offer fractional ownership programs for high-end motorhomes, where multiple families jointly purchase and share usage of an RV.
- The RV rental market has expanded significantly, with both traditional rental fleets and newer peer-to-peer networks.
- These sharing models allow would-be RVers to experience the lifestyle without full ownership commitment.
- Owners can offset their costs by monetizing their RVs during idle periods (the typical RV sits unused for about 335 days per year1).
How does RV ownership compare with vanlife and mobile living trends?
The "vanlife" movement, built largely around social media, has drawn a new wave of people into traveling and living in vans.
- Vanlifers typically drive Class B camper vans or DIY-converted cargo vans, focusing on minimalism and mobility rather than luxury.
- Traditional RV ownership often involves maintaining a permanent home base and using the RV for vacations, while vanlife and full-time RVing represent a more committed mobile lifestyle.
- DIY van conversions can cost significantly less than manufactured RVs (new Class B campervans average $100,000-$150,000, according to Go RVing17).
- Younger RV owners often prefer smaller, more nimble vehicles like campervans.
RV rental in the USA
- Austin RV rental
- RV rental in Cincinnati
- Colorado RV rental
- Las Vegas RV rental
- Los Angeles
- Phoenix
- Pittsburgh motorhome rental
- RV rental in San Diego
- San Francisco
- Seattle
- Houston motorhome rental
- Tampa
References
- Go RVing 2025 RV Owner Demographic Profile (RV Industry Association) · rvia.org ↑ b c d e f g h i j k
- RV Shipments End 2025 with 342,220 Units, Modest 2.5% Growth over 2024 (RV Industry Association, December 2025 shipment report) · rvia.org ↑ b c d e f g
- Quarterly Census of Employment and Wages: RV (recreational vehicle) dealers, NAICS 441210, 2024 annual averages (U.S. Bureau of Labor Statistics) · data.bls.gov ↑ b c d e
- Go RVing Study Finds RV Owners Continue Youthful Trend (RV News, on the Go RVing 2025 RV Owner Demographic Profile) · rvnews.com ↑ b
- Study Finds RV Owners Younger as Numbers Grow (RV News, on the Go RVing RV Owner Demographic Profile) · rvnews.com ↑ b
- SSI: '22 Retail Sales Totaled 447,718, Down 21.55% · woodallscm.com ↑
- SSI: '24 Retail Registrations Show 6.9% Decrease vs. '23 · rvbusiness.com ↑
- Go RVing 2025 RV Owner Demographic Profile Overview (Public Report, RV Industry Association) · rvia.org ↑ b c d e f g h i j k l
- RVIA: 2024 Wholesale Shipments Up 6.6% Year Over Year (RVBusiness, citing the RV Industry Association December 2024 survey) · rvbusiness.com ↑ b
- Historical RV Shipments, 1980 to present (RV Industry Association) · rvia.org ↑ b
- RVIA Confirms 2021 Record Shipments (RV News) · rvnews.com ↑ b c
- 2022 RV Shipments Surpass 493,000 for Third Best Year on Record (RV Industry Association) · rvia.org ↑
- RV Shipments Top 313,000 for 2023; Up 8.1% in December (RVBusiness, citing the RV Industry Association December 2023 survey) · rvbusiness.com ↑
- RV Industry Profile — wholesale shipments by destination state (RV Industry Association) · rvia.org ↑ b c d
- Go RVing RV Owner Demographic Profile Study, 2021 (RV Industry Association) · rvia.org ↑
- The RV Consumer in 2005 (Richard T. Curtin, University of Michigan Surveys of Consumers) · data.sca.isr.umich.edu ↑ b c
- Compare RVs: size, average cost and sleeping capacity by RV type (Go RVing, RV Industry Association) · gorving.com ↑ b c d e f g
- Quarterly Census of Employment and Wages: RV (recreational vehicle) dealers, NAICS 441210, 2014 annual averages (U.S. Bureau of Labor Statistics) · data.bls.gov ↑ b
- RVIA: 23 Million Americans are Planning RV Trips this Autumn (RVBusiness, Aug 2026) · rvbusiness.com ↑ b
- 16 Million Americans Plan to Go RVing over Labor Day Weekend · rvia.org ↑
- RV Quick Facts (RV Industry Association), archived August 2019 · web.archive.org ↑
- Quarterly Census of Employment and Wages: RV parks and campgrounds, NAICS 721211, 2024 annual averages (U.S. Bureau of Labor Statistics) · data.bls.gov ↑ b
- RV Industry Association (RVIA) — RV shipments, economic impact, and owner demographics · rvia.org
- RV Dealers Association (RVDA) — dealer networks and sales · rvda.org
- University of Michigan (Deep Blue) — studies on RV consumer behavior and ownership · deepblue.lib.umich.edu
- U.S. Census Bureau (data.census.gov) — business dynamics data for the RV industry · data.census.gov
- Kampgrounds of America (KOA) — annual camping reports · koa.com