

Updated
Zion National Park at a glance
- 4.98 million people visited Zion National Park in 2025, its second-highest total on record.1
- Zion was the 2nd most visited national park in the U.S. in 2025.2
- 2026 so far: 3.37 million visits from January to August, 2.5% fewer than in the same months of 2025.3
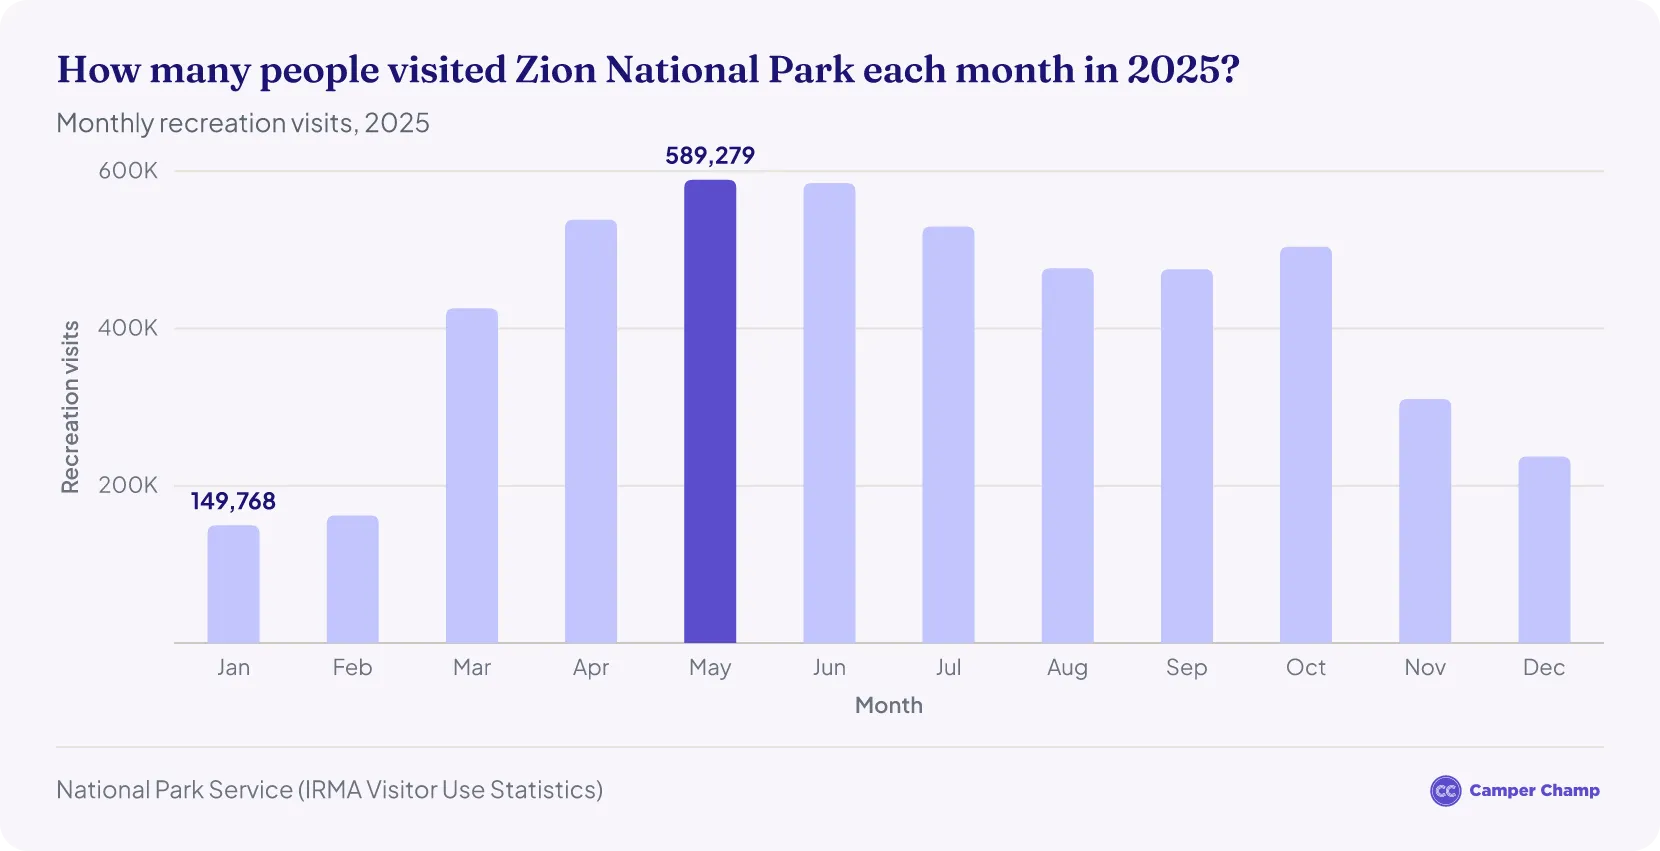
- May was the busiest month in 2025, with 589,279 visits.3
- Visitors spent $774.19 million in the area around the park in 2024.4
How many people visit Zion National Park each year?
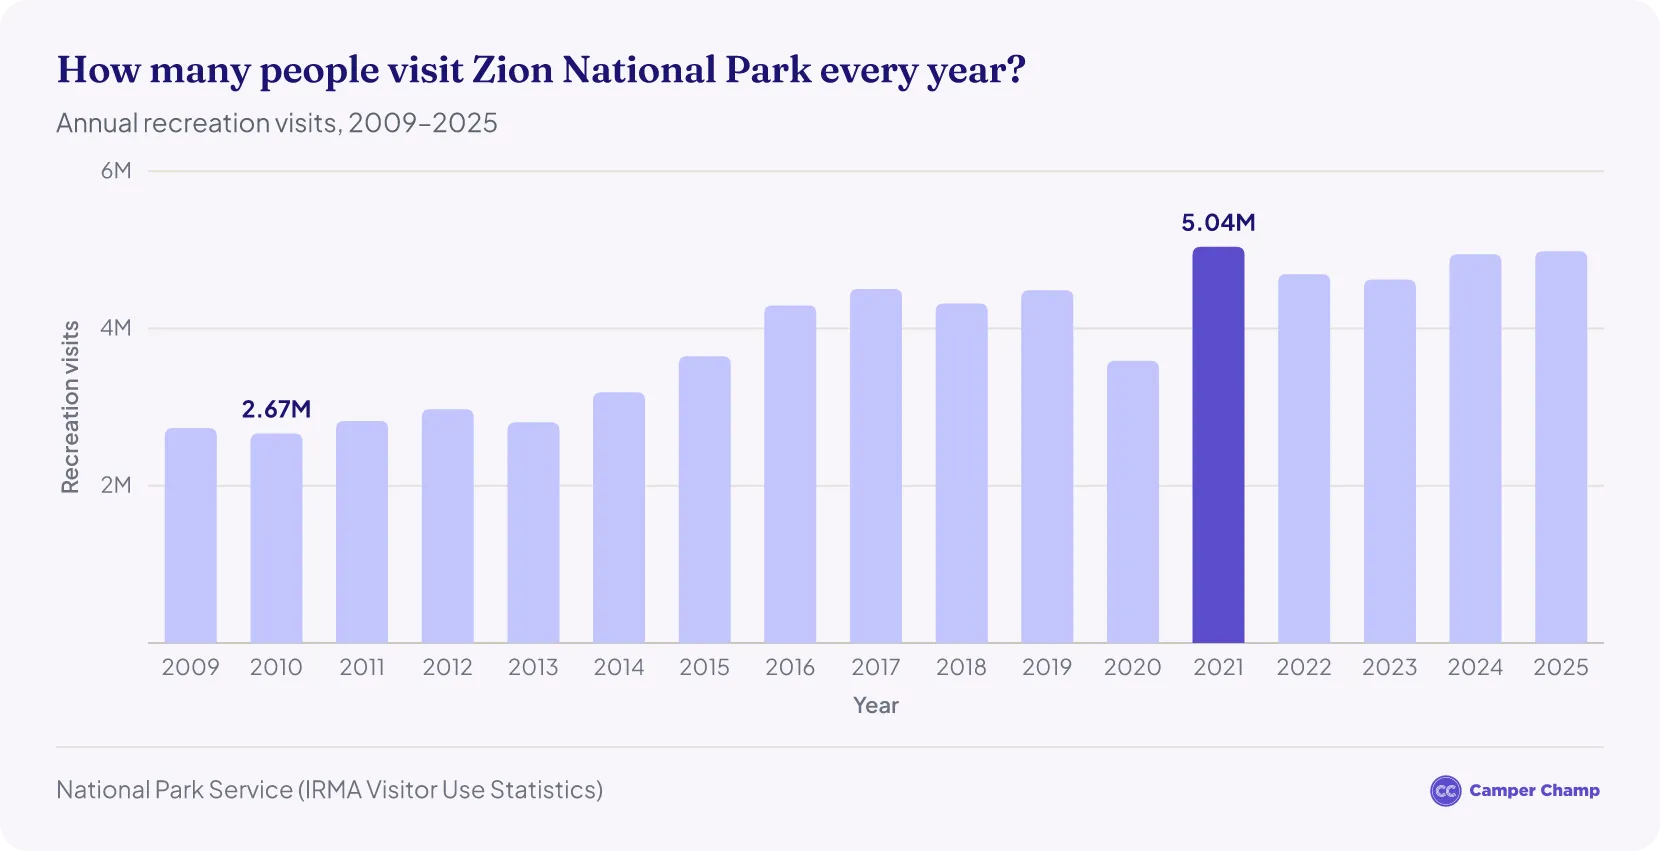
Over 4.98 million tourists visited Zion National Park in 20251.
- Zion National Park welcomed 4.49 million visitors in 2019.1 However, when the pandemic hit in 2020, this number dropped by 20% to 3.59 million.
- By 2021, visitor numbers began to recover, reaching 5.04 million.1
- Tourist numbers dropped in 2022 and 2023, with 4.69 million and 4.62 million visits, respectively.1
- Visitor numbers climbed again to 4.95 million in 2024 and 4.98 million in 2025, the second-highest total on record after 2021.1
How many people visited Zion National Park in 2026?
From January to August 2026, 3.37 million people visited Zion National Park, 2.5% fewer than in the same months of 2025.3
- May was the busiest month so far, with 581,977 visits.3
- March saw the biggest rise, up 15% on March 2025 to 489,961 visits.3
- August had 410,409 visits, 14% fewer than a year earlier and the steepest monthly drop so far.3
Note: 2026 data is preliminary and subject to change.
| Month | 2026 Visits | 2025 Visits | Change |
|---|---|---|---|
| January | 153,088 | 149,768 | +2.2% |
| February | 176,022 | 162,438 | +8.4% |
| March | 489,961 | 425,780 | +15.1% |
| April | 527,200 | 538,541 | -2.1% |
| May | 581,977 | 589,279 | -1.2% |
| June | 545,569 | 585,040 | -6.7% |
| July | 485,756 | 529,798 | -8.3% |
| August | 410,409 | 476,657 | -13.9% |
| Total (Jan–Aug) | 3,369,982 | 3,457,301 | -2.5% |
Source · National Park Service, Recreation Visitors By Month, Zion NP (2026 figures are preliminary).
How many people visited Zion National Park in 2025?
- In 2025, Zion National Park welcomed a total of 4.98 million visitors1. This marked an 11% increase compared to 2019. The park also recorded 253,718 overnight stays in park lodging, campgrounds and the backcountry.5
- That is about 13,700 visits a day on average.1 In May, the busiest month, it was about 19,000 a day.3
How has Zion National Park's visitor count changed since 1919?
Zion has welcomed more than 152.5 million visitors since it became a national park in 1919.1
- In 1919, its first year as a national park, Zion recorded just 1,814 visits.1
- Visits passed 100,000 for the first time in 1936, with 124,393, then fell to 42,243 in 1944, during World War II.1
- Zion first topped 1 million visits in 1975 (1,055,200) and 2 million in 1990 (2,102,400).1
- Growth sped up in the 2010s: visits passed 3 million in 2014 and 4 million in 2016.1
- The record is 5.04 million visits in 2021.1 The 4.98 million visits in 2025 are the second-highest total.
- The busiest month since monthly records began in 1979 was June 2021, with 675,799 visits.3
| Year | Recreation Visits |
|---|---|
| 1919 | 1,814 |
| 1920 | 3,692 |
| 1930 | 55,297 |
| 1940 | 165,029 |
| 1950 | 323,402 |
| 1960 | 575,800 |
| 1970 | 903,600 |
| 1980 | 1,123,846 |
| 1990 | 2,102,400 |
| 2000 | 2,432,348 |
| 2010 | 2,665,972 |
| 2020 | 3,591,254 |
| 2021 | 5,039,835 |
| 2025 | 4,984,525 |
Source · National Park Service, Annual Park Recreation Visitation (1904 – Last Calendar Year), Zion NP.
How much do visitors spend at Zion National Park every year?
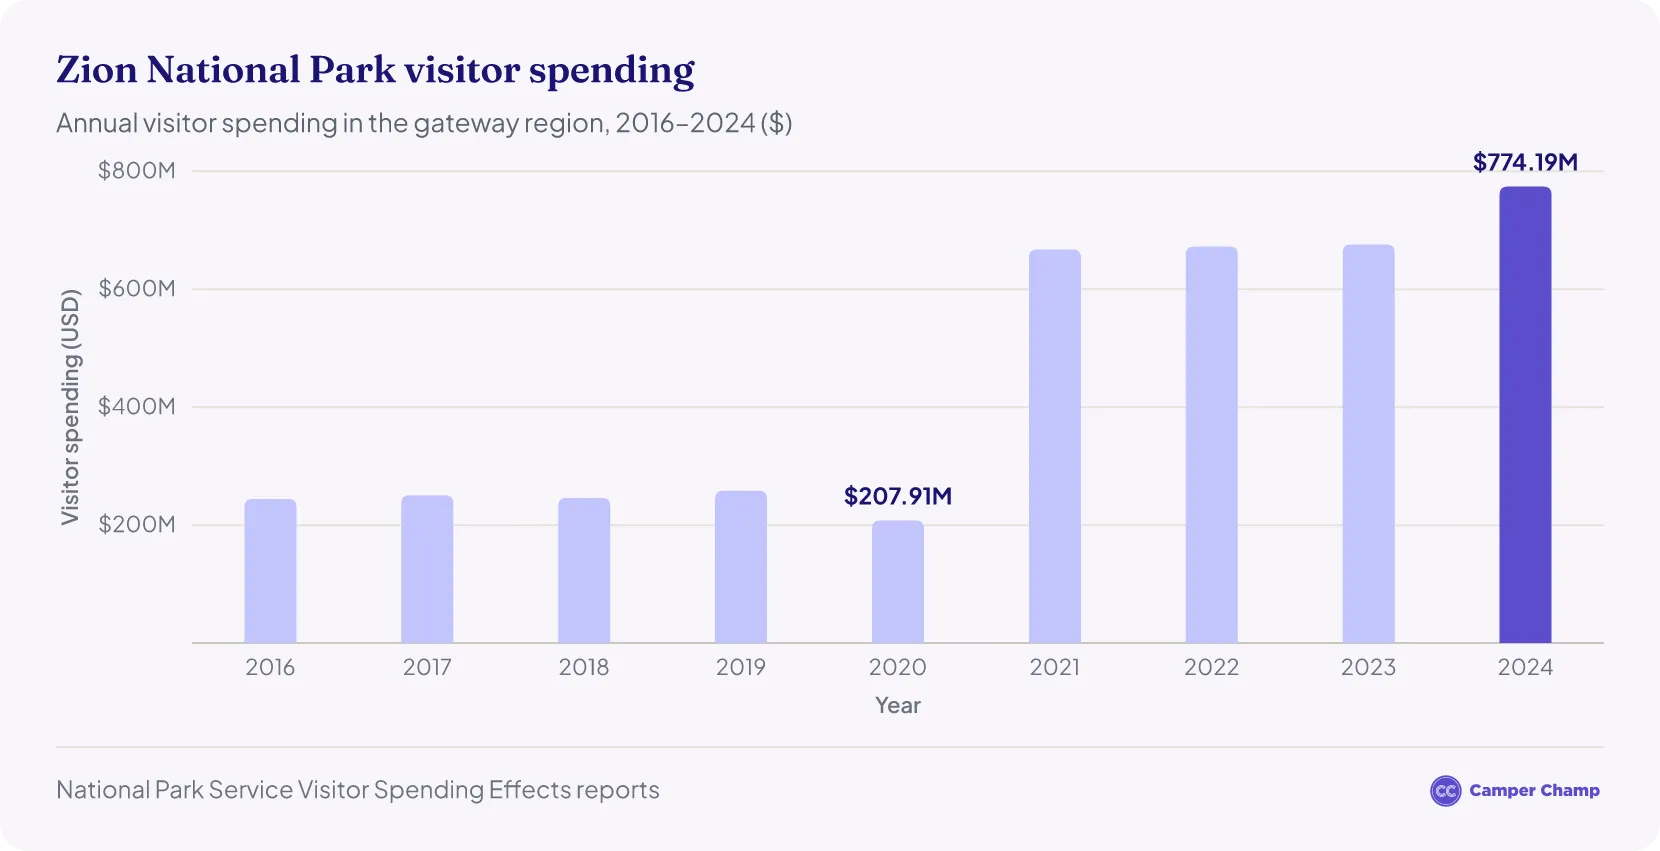
In 2024, visitor spending at Zion National Park amounted to $774.19 million.4
- In 2019, visitors to Zion National Park generated $258.36 million in expenditure.6 However, in 2020, visitor spending dropped by 20% to $207.91 million.7
- Zion National Park recovered in 2021, with $667.49 million spent by tourists.8 Most of this jump reflects a change in method rather than real growth: from 2021, the Park Service based Zion's estimate on new visitor surveys, which found earlier figures had underestimated how long visitors stayed and how much they spent.9
- In 2022, tourist spending amounted to $672.43 million10, and in 2023, this increased by less than 1% to $676.04 million.11 In 2024, spending climbed a further 15% to $774.19 million, 200% above the 2019 level, though figures before and after 2021 are not directly comparable.4
- Visitor spending in 2024 supported 8,564 jobs in the area around the park and generated $1.05 billion in economic output.4
Note: These figures are from the National Park Service's 2024 Visitor Spending Effects report, released in September 2025. It is the latest edition; the 2025 figures have not been published yet.
How popular is Zion National Park?
- Zion National Park ranked 6th in U.S. News' Best U.S. National Parks for 2026.12 Popular hikes include Angels Landing and The Narrows, where hikers wade up the Virgin River, as far as Big Spring on a 10-mile round trip or 16 miles through the whole canyon with a permit.13
- Zion National Park ranked 2nd as the most visited national park in the U.S. in 2025.2
| Rank | Park | Recreation Visits | % of Total |
|---|---|---|---|
| 1 | Great Smoky Mountains NP | 11,527,939 | 12.28% |
| 2 | Zion NP | 4,984,525 | 5.31% |
| 3 | Yellowstone NP | 4,762,988 | 5.07% |
| 4 | Grand Canyon NP | 4,430,653 | 4.72% |
| 5 | Yosemite NP | 4,278,413 | 4.56% |
| 6 | Rocky Mountain NP | 4,171,431 | 4.44% |
| 7 | Acadia NP | 4,079,318 | 4.34% |
| 8 | Grand Teton NP | 3,800,648 | 4.05% |
| 9 | Olympic NP | 3,584,187 | 3.82% |
| 10 | Glacier NP | 3,136,557 | 3.34% |
Source · National Park Service, Annual Park Ranking Report for Recreation Visits (2025); % of total is each park's share of all national park recreation visits.
- Read more about the U.S. National Park Ranking.
- See the visitor numbers for other parks in the top 10: Great Smoky Mountains, Yosemite, Rocky Mountain, Acadia, Grand Teton and Olympic.
How does Zion compare with Utah's other national parks?
Zion is by far the busiest of Utah's five national parks.2 In 2025, it had 4.98 million visits, more than 2.5 times as many as Bryce Canyon, the next busiest, with 1.97 million.
| Park | 2025 Visits | Share of Utah Total |
|---|---|---|
| Zion | 4,984,525 | 46.8% |
| Bryce Canyon | 1,967,367 | 18.5% |
| Arches | 1,511,740 | 14.2% |
| Capitol Reef | 1,388,476 | 13.0% |
| Canyonlands | 796,057 | 7.5% |
Source · National Park Service, Annual Park Ranking Report for Recreation Visits (2025). Share is each park's share of all visits to Utah's five national parks.
When is the best time to visit Zion National Park?
- Winter (December to February): the quietest time to visit. January 2025 had 149,768 visits, the fewest of any month and about a quarter of May's total.3
- Spring (March to May): crowds build fast. Visits more than doubled from 162,438 in February 2025 to 425,780 in March, and May was the busiest month with 589,279.3
- Summer (June to August): still very busy, with 585,040 visits in June 20253, and midday heat makes long hikes harder.
- Fall (September to November): cooler temperatures make fall the best season for long hikes. Visits stayed high in September (475,492) and October (504,122) before dropping to 310,439 in November.3
- Year-round: Zion is open all year, so a winter trip is the surest way to avoid the crowds.
What were Zion National Park’s peak tourist months in 2025?
These were Zion National Park's five busiest months in 20253:
- May had the highest number of visitors with 589,279 visits, when mild spring weather made for good hiking before the summer heat.3
- June followed closely with 585,040 visitors, thanks to the peak summer season, long days and school breaks.3
- With 538,541 visitors, April drew hikers with cool spring temperatures.3
- July had 529,798 visitors at the height of the summer season.3
- October saw 504,122 visitors, drawn by cooler weather and fall colors.3
How many people camp at Zion National Park?
Campers spent 172,663 nights in Zion's campgrounds and backcountry in 2025, about 14% fewer than the 200,444 in 2024 and the lowest total since 2020.5 The Park Service counts camping in overnight stays, so one person camping for one night is one stay.
| Year | Tent | RV | Backcountry | Total Camping |
|---|---|---|---|---|
| 2019 | 118,290 | 78,704 | 18,320 | 215,314 |
| 2020 | 81,108 | 61,792 | 4,906 | 147,806 |
| 2021 | 138,730 | 89,919 | 15,071 | 243,720 |
| 2022 | 133,666 | 93,947 | 10,375 | 237,988 |
| 2023 | 100,411 | 85,948 | 8,497 | 194,856 |
| 2024 | 94,830 | 94,744 | 10,870 | 200,444 |
| 2025 | 78,003 | 84,450 | 10,210 | 172,663 |
Source · National Park Service, Overnight Stays (1979 – Last Calendar Year), Zion NP. One overnight stay is one person camping for one night.
How do campers stay overnight in Zion National Park?
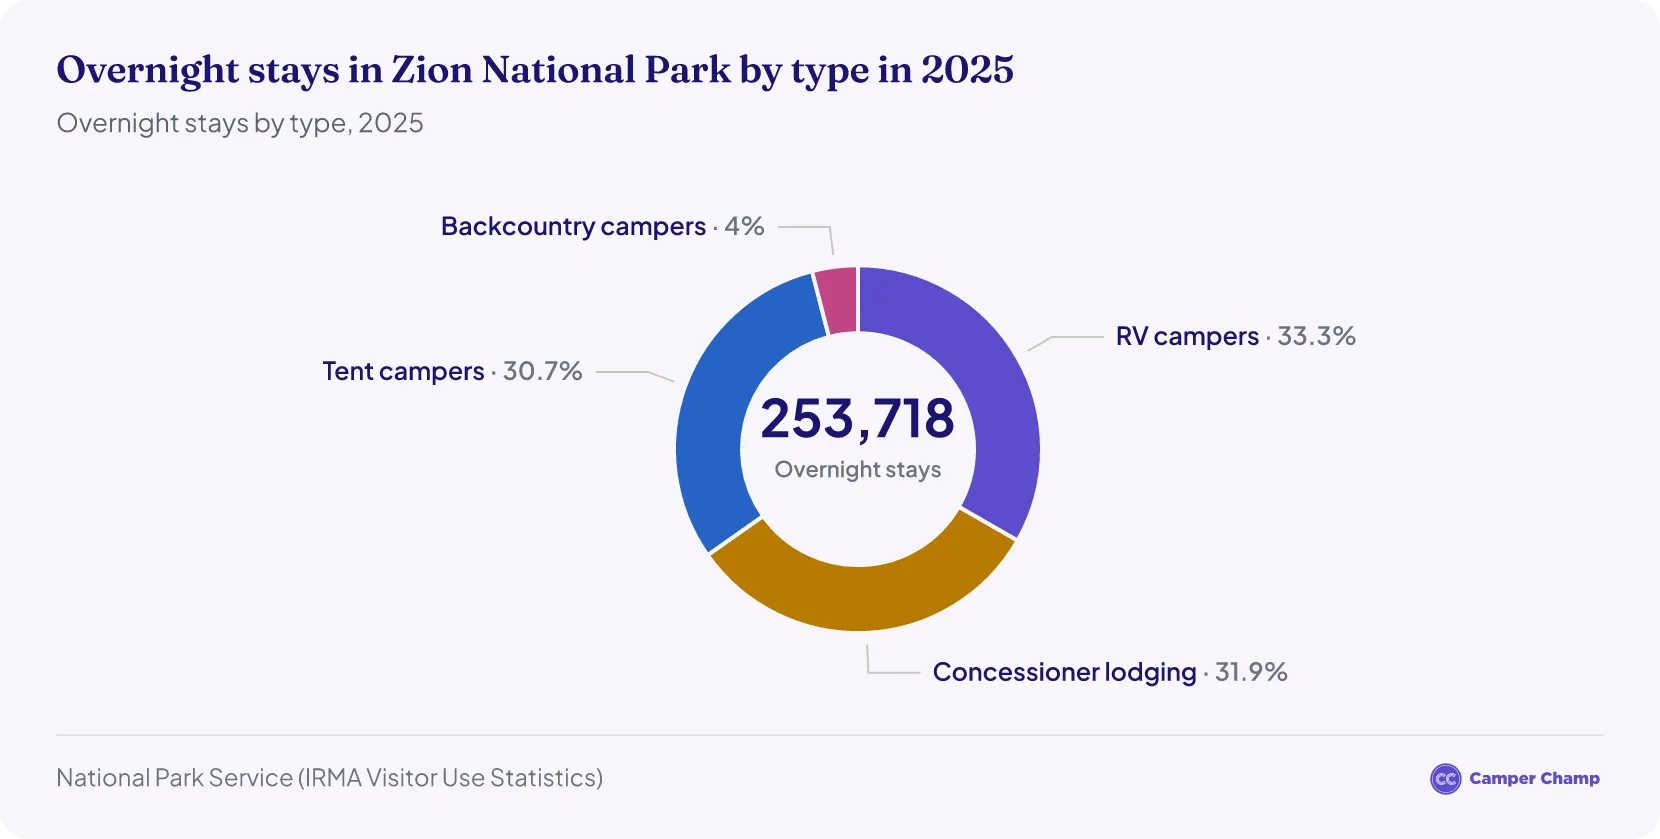
- Tent camping has fallen by 44% since 2021, from 138,730 overnight stays to 78,003, and RV camping overtook it in 2025.5
- RV Camping was the most popular option in 2025, with 84,450 overnight stays.5
- Concessioner Lodging inside the park accounted for 81,055 overnight stays.5
- Tent Camping accounted for 78,003 overnight stays.5
- Backcountry Camping accounted for 10,210 overnight stays.5
RV rental in the USA
- RV rental in Las Vegas
- RV rental in Cincinnati
- RV rental in Denver
- RV rental in Los Angeles
- Minneapolis RV rental
- RV rental in New York
- Pittsburgh RV rental
- RV rental in Portland
- Salt Lake City RV rental
- RV rental in San Jose
Zion National Park Facts
- Established: Zion National Park, established in 191914, is Utah’s first national park15.
- First protected: In 1909, as Mukuntuweap National Monument, covering about 16,000 acres.16
- Size: 232 square miles, with about 5,000 feet between its lowest point, Coal Pits Wash (3,666 feet), and its highest, Horse Ranch Mountain (8,726 feet).17
- Famous Features: Navajo Sandstone cliffs up to 2,000 feet tall, in red, pink and white14.17
- Popular Hikes: Angels Landing and The Narrows are the park's best-known hiking trails.
- Wildlife: About 78 species of mammals, 291 of birds, 30 of reptiles, 8 of fish and 7 of amphibians, plus more than 1,000 plant species.17
- Geology: Rock layers laid down over about 250 million years17, cut into deep canyons and narrow slot canyons.
Other Resources
- Biscayne National Park Tourism Statistics
- Everglades National Park Tourism Statistics
- Grand Teton National Park Tourism Statistics
- Great Smoky Mountains National Park Tourism Statistics
- Joshua Tree National Park Tourism Statistics
- Olympic National Park Tourism Statistics
- Rocky Mountain National Park Tourism Statistics
- US National Parks Statistics
- Voyageurs National Park Tourism Statistics
- White Sands National Park Tourism Statistics
- Wildlife Statistics in the USA
- Yosemite National Park Tourism Statistics
What are the most common causes of death in Zion National Park?
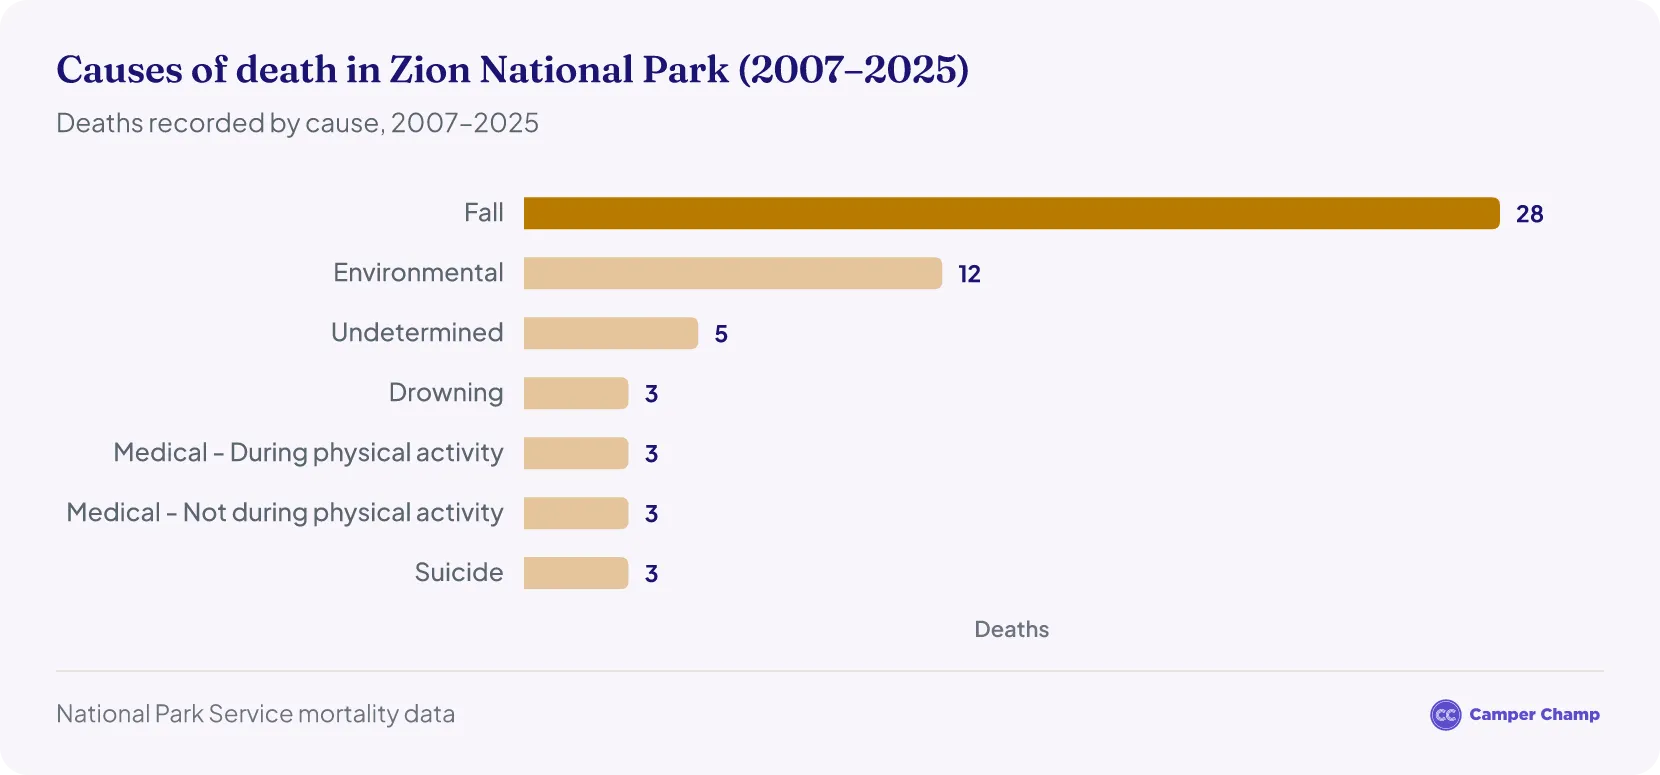
There were 57 recorded deaths in Zion National Park between 2007 and 2025.18 That is about 0.8 deaths for every million visits, out of 71.7 million visits over the same years.1 Here are the main causes of death in the park:
- Fall (28 deaths)18
- Environmental (12 deaths)18
- Undetermined (5 deaths)18
- Drowning (3 deaths)18
- Medical Emergency - During Physical Activity (3 deaths)18
- Medical Emergency - Not During Physical Activity (3 deaths)18
- Suicide (3 deaths)18
Before 2014, the Park Service recorded only unintentional deaths, such as falls and drownings, so the 57 deaths and 0.8 per million visits undercount the years 2007 to 2013.18 Figures from 2020 onward are provisional and may change.
Zion National Park Safety Tips
When visiting Zion National Park, plan for heat, sudden weather changes and steep terrain:
- Stay Hydrated: Carry at least one gallon of water per person per day.19
- Heat and Sun: Watch for signs of heat exhaustion and stroke, and rest in shady areas.
- Flash Floods: Be aware of changing weather conditions, especially during monsoon season.
- Cliff Safety: Stay on trails and keep away from cliff edges.
- Wildlife Danger: Keep a safe distance from animals and avoid feeding them.
Zion National Park FAQs
Is Zion the busiest national park in Utah?
Yes. Zion had 4.98 million visits in 2025, more than 2.5 times as many as Bryce Canyon, Utah's next busiest national park.2
What was Zion National Park's busiest year?
2021, with 5,039,835 visits. 2025 was the second-busiest year, with 4,984,525.1
When is Zion National Park least crowded?
January is the quietest month. Zion had 149,768 visits in January 2025, compared with 589,279 in May, its busiest month.3
How many people have visited Zion in 2026?
3.37 million people visited from January to August 2026, 2.5% fewer than in the same months of 2025. The 2026 figures are preliminary.3
How big is Zion National Park?
Zion covers 232 square miles in Washington, Iron and Kane counties in southwestern Utah.17
Do you need a permit to hike Angels Landing?
Yes. Permits are given out by lottery on recreation.gov, either in a seasonal lottery or the day before your hike. Applying costs $6 for up to six people, plus $3 per person if you get a permit.20
References
- NPS IRMA Visitor Use Statistics — Annual Park Recreation Visitation (1904 – Last Calendar Year), Zion NP · irma.nps.gov ↑ b c d e f g h i j k l m n o p
- National Park Annual Visitation · irma.nps.gov ↑ b c d e f
- NPS IRMA Visitor Use Statistics — Recreation Visitors By Month (1979 – Last Calendar Year), Zion NP · irma.nps.gov ↑ b c d e f g h i j k l m n o p q r s t
- 2024 National Park Visitor Spending Effects: Economic Contributions to Local Communities, States, and the Nation (NPS Visitor Spending Effects report series) · nps.gov ↑ b c d
- NPS IRMA Visitor Use Statistics — Overnight Stays (1979 – Last Calendar Year), Zion NP · irma.nps.gov ↑ b c d e f g
- 2019 National Park Visitor Spending Effects: Economic Contributions to Local Communities, States, and the Nation · nps.gov ↑
- 2020 National Park Visitor Spending Effects: Economic Contributions to Local Communities, States, and the Nation · nps.gov ↑
- 2021 National Park Visitor Spending Effects: Economic Contributions to Local Communities, States, and the Nation · nps.gov ↑
- National Park Visitor Spending Contributed $42.5 Billion to U.S. Economy in 2021 · nps.gov ↑
- 2022 National Park Visitor Spending Effects: Economic Contributions to Local Communities, States, and the Nation · nps.gov ↑
- 2023 National Park Visitor Spending Effects: Economic Contributions to Local Communities, States, and the Nation (NPS Science Report NPS/SR—2024/174) · nps.gov ↑
- Best U.S. National Parks for 2026 · travel.usnews.com ↑
- The Narrows — Zion National Park (U.S. National Park Service) · nps.gov ↑
- NPS Geodiversity Atlas—Zion National Park, Utah (U.S. National Park Service) · nps.gov ↑ b
- Creation and Development of Zion National Park (Intermountain Histories) · intermountainhistories.org ↑
- History & Culture — Zion National Park (National Park Service) · nps.gov ↑
- Nature — Zion National Park (National Park Service) · nps.gov ↑ b c d e
- NPS Mortality Data, CY2007 onward (Prevention and Response Branch FOIA release) · nps.gov ↑ b c d e f g h i
- nps.gov ↑
- Angels Landing Hiking Permits — Zion National Park (National Park Service) · nps.gov ↑
- NPS: Facts and Figures – Visitations, Spending, Ranking, and Park Reports · nps.gov