

Updated
Las Vegas welcomed 38.5 million visitors in 2025, 7.5% fewer than in 20241, and they spent $50.8 billion in the city2. Tourism here is driven by its entertainment scene, casinos and luxury resorts – all of which attract millions of visitors annually. Beyond the Strip, travelers enjoy shopping, fine dining and visiting nearby natural attractions like Red Rock Canyon.
How many tourists visit Las Vegas each year?
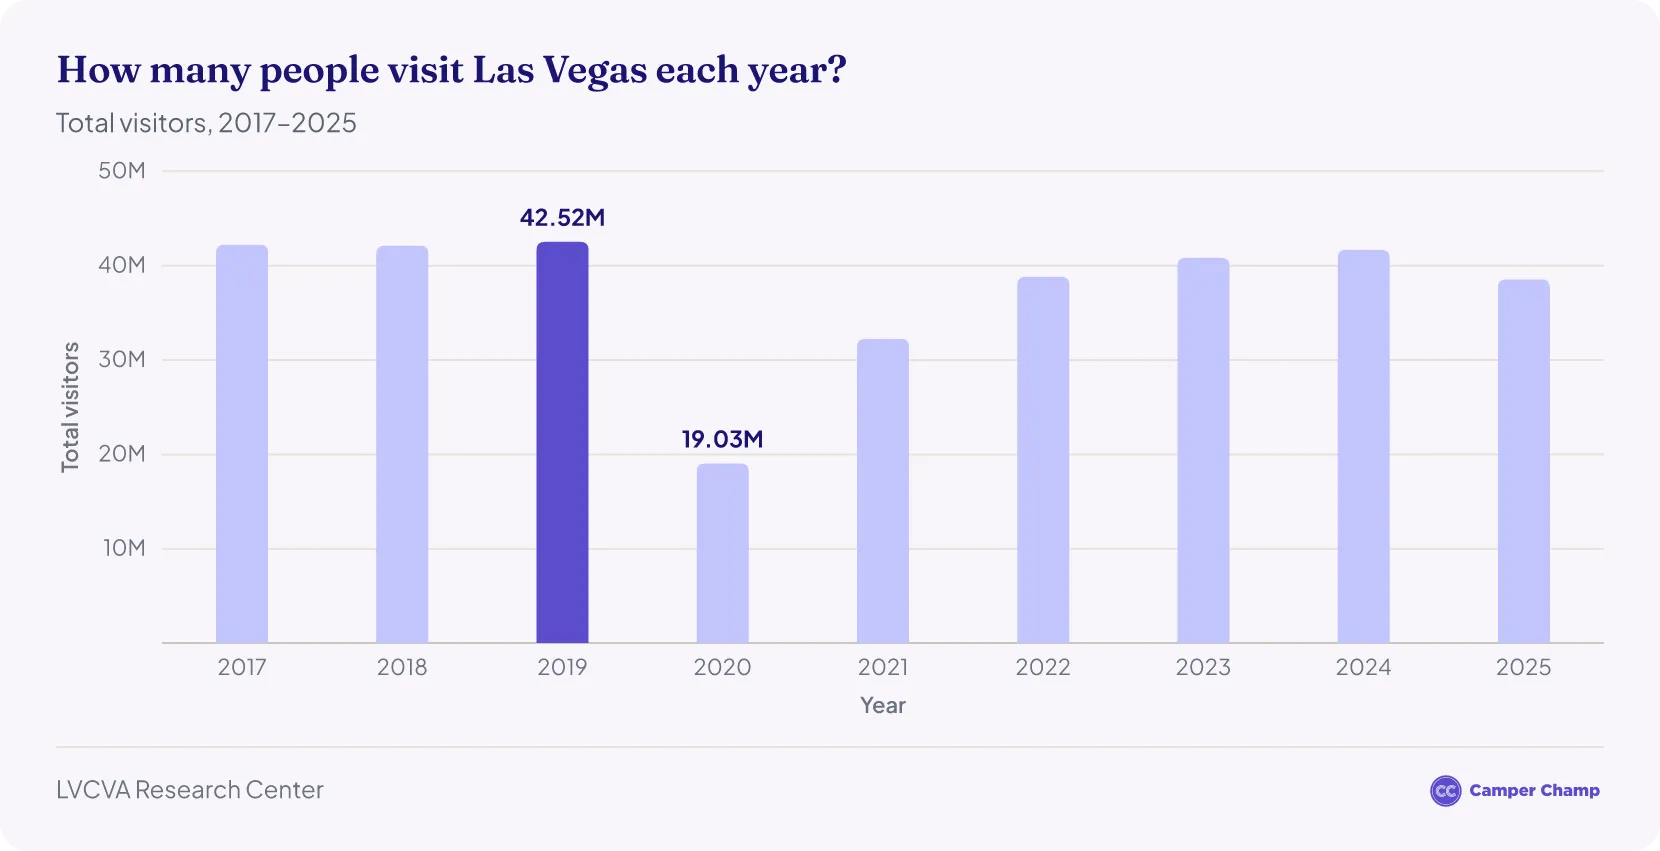
Around 40 million tourists visit Las Vegas annually, excluding the COVID-19 pandemic period.1
- Las Vegas welcomed around 42.5 million tourists in 2019.1
- Due to economic conditions and travel restrictions, the number of tourists dropped to 19 million in 2020.1
- In 2021, visitation recovered to 32.2 million.1
- The upward trend continued in 2022, recording 38.8 million tourists.1
- Tourist arrivals reached 41.7 million in 2024, nearing the pre-pandemic level of 2019, before falling 7.5% to 38.5 million in 2025.1
Las Vegas tourism in 2026 so far
- From January to July 2026, Las Vegas welcomed 22.75 million visitors, 0.5% more than in the same months of 2025.3
- Convention attendance rose 11.2% to 3.9 million.3
- Hotel occupancy averaged 81.3%, and the average daily room rate rose 3% to $188.04.3
- Air passengers fell 6.9% to 30.2 million, while daily traffic on I-15 at the California border rose 4.1% from January to June4, which may point to more visitors driving in.3
- Clark County gaming revenue rose 2.3% to $8.13 billion.3
Las Vegas visitors in 2025
- Las Vegas welcomed 38.5 million visitors in 2025, a 7.5% decrease from 2024 and 9.4% below the pre-pandemic level of 2019.1
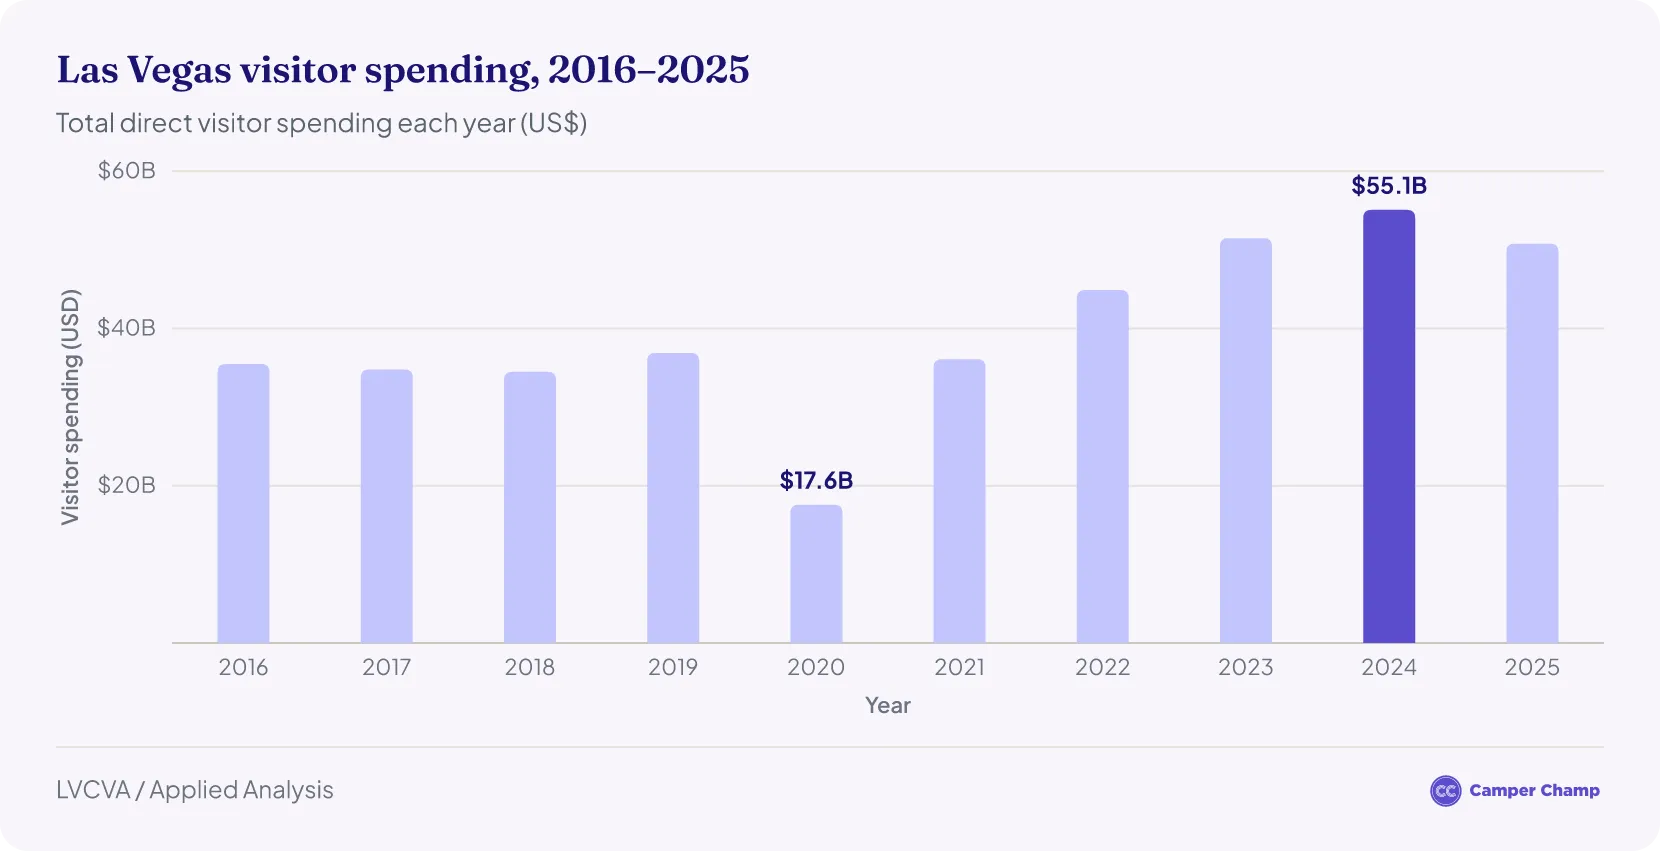
- Visitor spending fell 7.8% to $50.8 billion in 2025, down from a record $55.1 billion in 2024.2
- An estimated 4.7 million international visitors came to Las Vegas in 2025 (preliminary), 4.8% fewer than in 2024.5
Las Vegas visitors in 2024
- Las Vegas welcomed 41.7 million visitors in 2024, up 2.1% on 2023.6
Why is Las Vegas tourism down?
Las Vegas had 38.5 million visitors in 2025, 3.1 million fewer than in 2024.1 LVCVA data points to several drivers:
- Fewer visitors every month: each month of 2025 drew fewer visitors than the same month of 2024, with the steepest drops in July (-12%), February (-11.9%) and June (-11.3%).4
- Fewer Canadians: Canadian visits fell 17.4% to 1.2 million, while overseas arrivals held flat at 2.34 million, so almost all of the international decline came from Canada.5
- Fewer flights, emptier rooms: Harry Reid International Airport handled 55 million passengers, down from 58.4 million in 2024, and hotel occupancy slipped from 83.6% to 80.3%.1
- Cheaper rooms: the average daily room rate fell 4.5% to $184.43.4
- Shorter trips: visitors stayed 3.2 nights on average, down from 3.4 nights in 2024.7
- Gaming held up: Clark County gaming revenue rose to $13.69 billion, from $13.57 billion in 2024.1
Where do Las Vegas visitors come from?
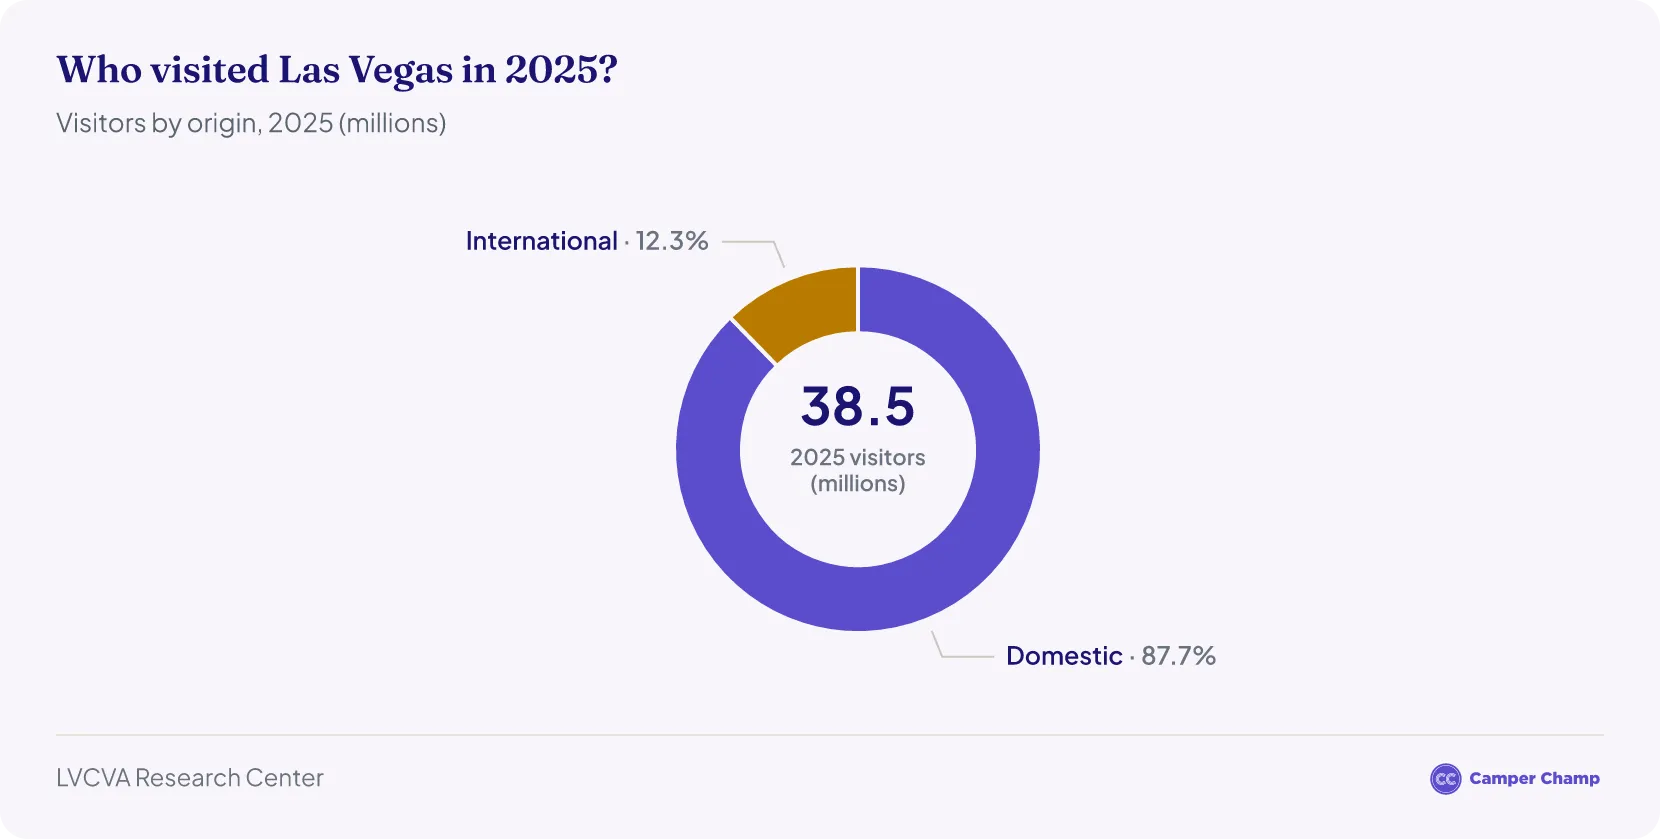
- In 2025, an estimated 4.7 million international visitors came to Las Vegas (preliminary): 1.2 million from Canada, 1.19 million from Mexico and 2.34 million from overseas. The UK (521,700), Australia (275,500) and Germany (176,400) were the largest overseas markets.5 Domestic visitors made up the rest, about 33.8 million or 87.7% of the total.1
- In 2023, 4.6 million international tourists visited Las Vegas. Among them, 2.4 million tourists were from North America (Canada and Mexico) and the remainder (2.2 million) from other countries.8
- In 2023, domestic tourists numbered approximately 36.2 million, 88.7% of the total.1
Who visits Las Vegas?
- Nine in ten visitors in 2025 had been to Las Vegas before; only one in ten was on a first trip.7
- The average visitor was 42.5 years old, down from 43.6 in 2024.7
- One in eight visitors came from abroad.7
- 81% of visitors gambled during their stay, with an average trip gaming budget of about $849.7
- Nearly nine in ten visitors were very satisfied with their trip, and three in five said Las Vegas exceeded their expectations.7
How long do visitors stay?
- In 2025, tourists visiting Las Vegas spent an average of 3.2 nights in the city. This figure reflects a slight decrease from the previous year, when the average stay was 3.4 nights.7
Why do people visit Las Vegas?
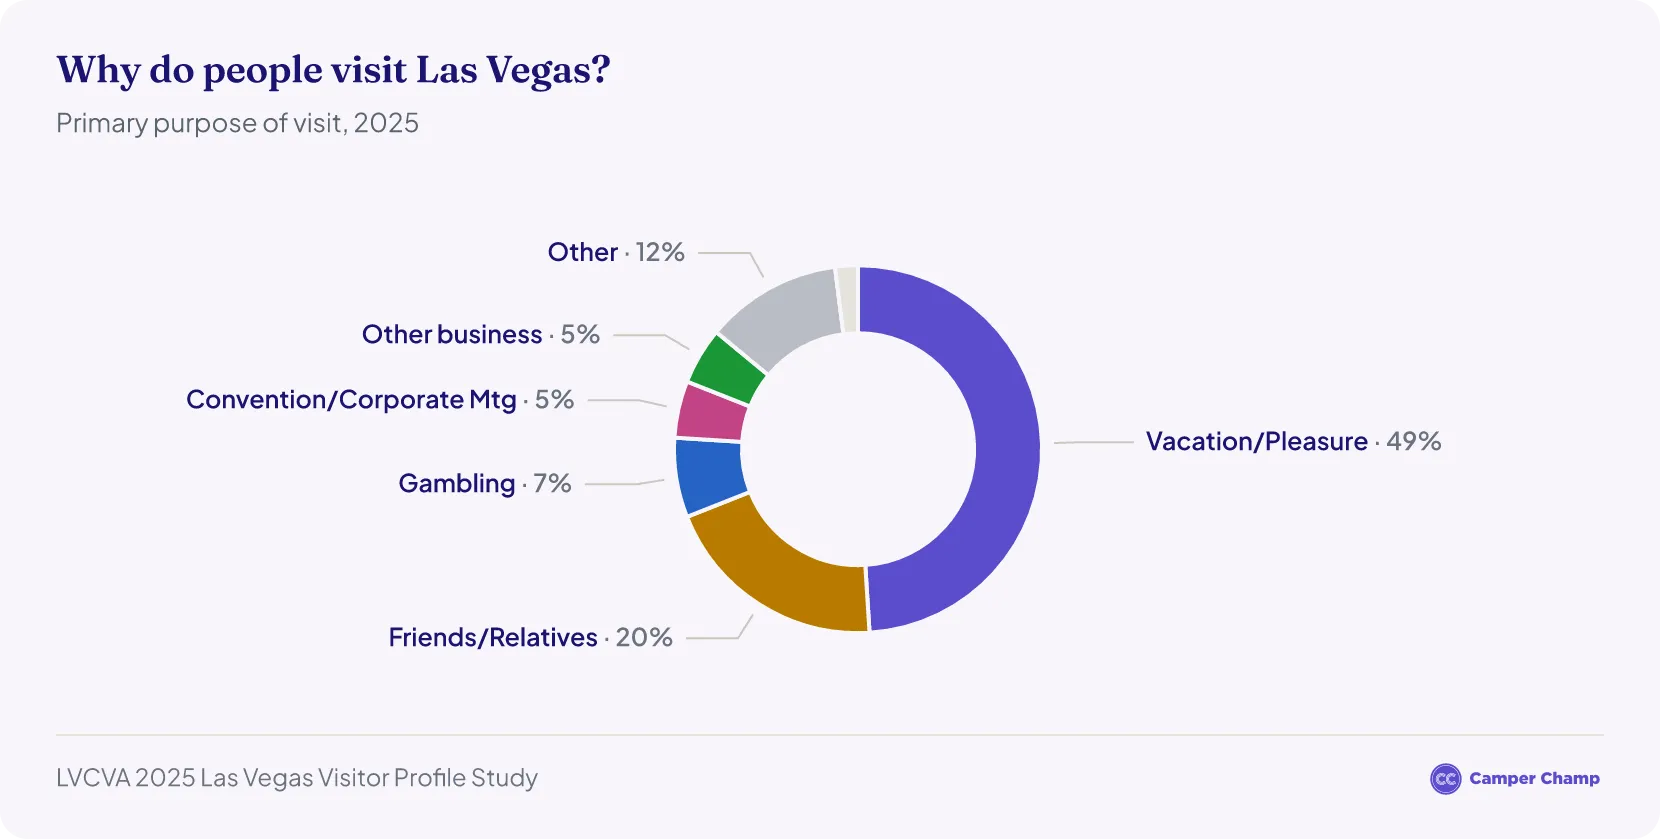
- For nearly half (49%) of 2025 visitors, the primary purpose of the trip was vacation/pleasure.7 Other common reasons included visiting friends and relatives (VFR), gambling, attending conventions or corporate meetings, special occasions, sports events and more.
- Many visitors come specifically to camp and explore natural areas like Red Rock Canyon, Lake Mead, and Valley of Fire. The camping directory The Dyrt lists 122 campgrounds and RV parks near Las Vegas,9 including 45 free dispersed camping areas.10
How do visitors get to Las Vegas?
- Just over half of visitors (53%) arrived in Las Vegas by road in 2025, and 47% flew in, much the same split as in 2024 (54% by road, 46% by air).7
Harry Reid International Airport
- Harry Reid International Airport handled 55 million arriving and departing passengers in 2025, down 5.9% from 58.4 million in 2024.1
- Domestic passenger traffic fell 5.9%, and international traffic fell 7.4%.2
- May was the airport's busiest month of 2025, with 4.99 million passengers.4
- From January to July 2026, passenger numbers fell another 6.9% to 30.2 million.3
Road trips to Las Vegas
- An average of 43,301 vehicles a day crossed into Nevada from California on I-15 in 2025, down 1.7% from 44,072 in 2024. July and August are left out of the 2025 average because roadworks near Primm disrupted the counts.4
- Road traffic has picked up in 2026: I-15 at the California border averaged 45,183 vehicles a day from January to July.3 Over January to June, the months counted in both years, it averaged 44,229 a day, up 4.1% on 42,501 in 2025.4 Another 16,802 vehicles a day crossed from Arizona on I-11 at Hoover Dam.3
- About one in ten visitors (11%) also visited other places in Nevada before or after their stay in Las Vegas.7
- For the bigger picture, see camping statistics for the USA and North America.
These air and road counts include residents, commuters and through traffic as well as visitors.4
RV rental in the USA
- RV rental in Las Vegas
- Albuquerque RV rental
- RV rental in Chicago
- RV rental in Cincinnati
- RV rental in Los Angeles
- RV rental in New York
- RV rental in Orlando
- Pittsburgh RV rental
- San Francisco RV rental
- RV rental in Washington Dc
What are the most visited attractions in Las Vegas?
- The Strip is the 4-mile stretch of luxury hotels, casinos and entertainment venues at the center of a city that welcomed 38.5 million visitors in 2025.1
- Bellagio Resort and Fountain Show is one of the Strip's best-known sights, thanks to its free water fountain show set to music.
- The Venetian Resort, known for its gondola rides, offers a Venice-like experience on the Strip.
- Red Rock Canyon National Conservation Area, located 17 miles west of the Strip, is the desert reserve that draws more than 3 million visitors each year.11
- Mandalay Bay Resort is a popular spot for families and houses the Shark Reef Aquarium.
How much do tourists spend in Las Vegas?
- Visitors spent $50.8 billion in Las Vegas in 2025, down 7.8% from a record $55.1 billion in 2024.2
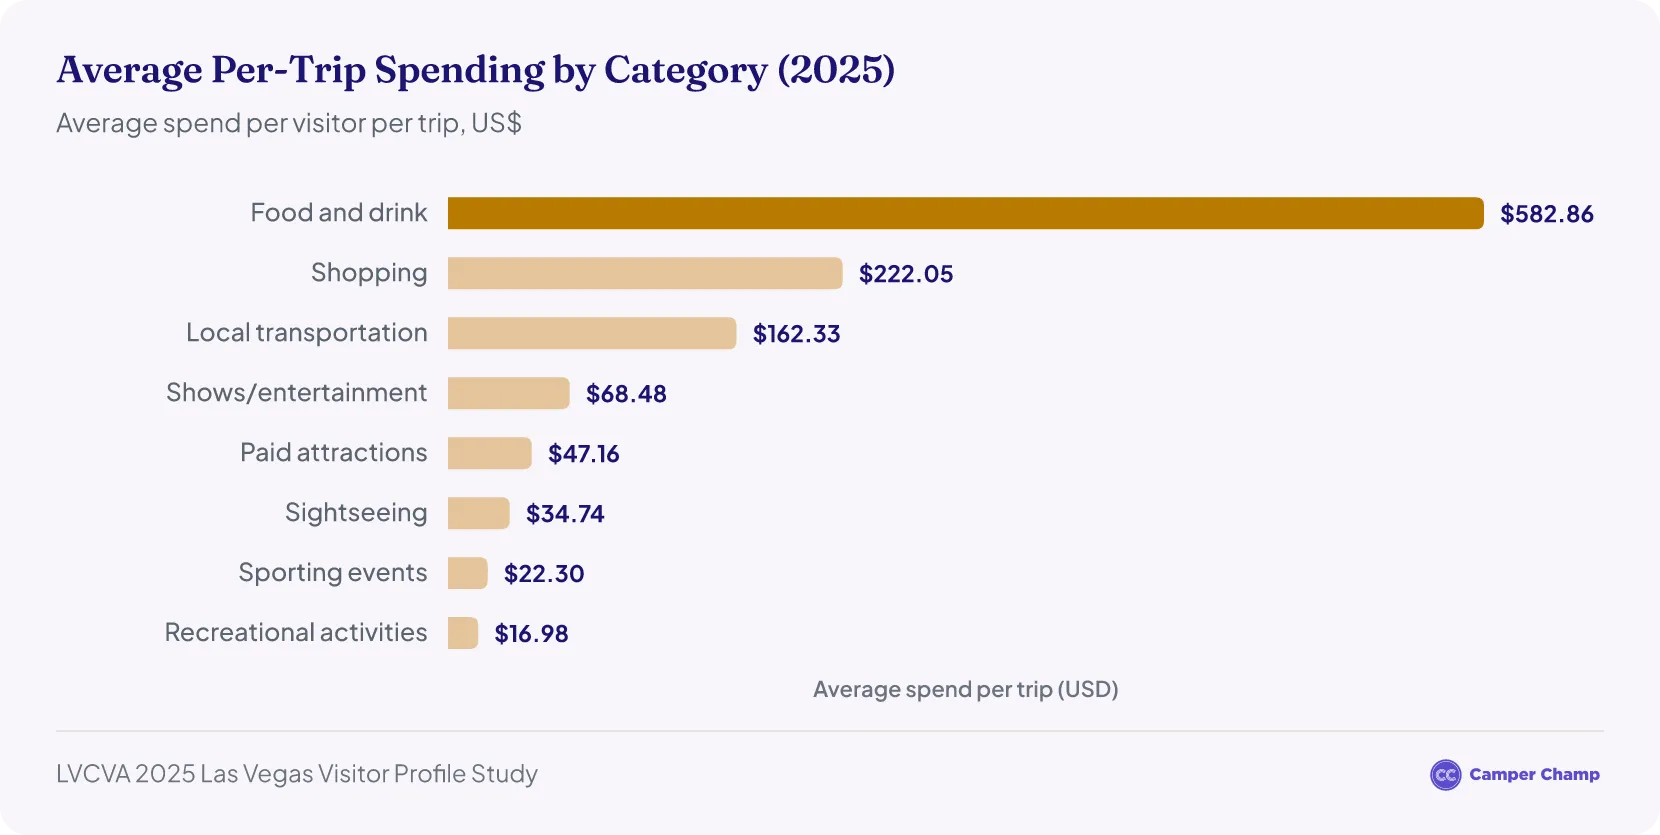
How much does it cost to visit Las Vegas?
- In 2025, visitors spent the most on food and drink, averaging $582.86 per trip. This was followed by shopping at $222.05, local transportation at $162.33, shows and entertainment at $68.48, paid attractions at $47.16, sightseeing at $34.74, sporting events at $22.30 and recreational activities at $16.98.7
Las Vegas hotel occupancy and room rates
- Las Vegas had about 150,300 hotel rooms in 2025, and on average 80.3% of them were occupied.4
- Occupancy was 83.2% on the Strip and 67.5% Downtown. Weekends ran at 88.8%, against 76.6% midweek.4
- The average daily room rate was $184.43: $197.45 on the Strip and $98.75 Downtown.4
- Visitors filled 44 million room nights over the year.4
Busiest and quietest months
- May was the busiest month of 2025 with 3.42 million visitors, followed by October (3.41 million) and March (3.39 million).4
- February was the quietest month, with 2.97 million visitors.4
- Hotels were fullest in April (84.6% occupancy) and emptiest in July (76.1%).4
- Summer is the cheapest time to stay: the average room rate fell to $154.72 in July, against a high of $203.89 in October.4
Las Vegas tourism FAQs
How many tourists visit Las Vegas a year?
Las Vegas welcomed 38.5 million visitors in 2025, down 7.5% from 41.7 million in 2024. The record is 42.9 million visitors, set in 2016.1
How many tourists visit Las Vegas per day?
About 105,600 a day on average in 20251 (38.5 million visitors ÷ 365 days).
What is the busiest month in Las Vegas?
May was the busiest month in 2025, with 3.42 million visitors. February was the quietest, with 2.97 million.4
How long do tourists stay in Las Vegas?
Visitors stayed 3.2 nights (4.2 days) on average in 2025, down from 3.4 nights in 2024.7
Other Resources
- Florida Tourism Statistics
- Miami Tourism Statistics
- Orlando Tourism Statistics
- San Francisco Tourism Statistics
References
- Las Vegas Historic Tourism Statistics 1970–2025 (LVCVA Research Center) · lvcva.com ↑ b c d e f g h i j k l m n o p q
- The Economic Impact of Southern Nevada's Tourism Industry (Economic Impact Series, July 2026) · lvcva.com ↑ b c d e
- LVCVA Summary of Monthly Tourism Indicators for Las Vegas, NV — Year-to-Date Summary for 2026 (January–July, as of August 27, 2026) · lvcva.com ↑ b c d e f g h i
- LVCVA Summary of Monthly Tourism Indicators for Las Vegas, NV — Year-End Summary for 2025 (revised) · lvcva.com ↑ b c d e f g h i j k l m n o p q
- Las Vegas International Visitation Estimates by Origin Market 2010–2025, preliminary (LVCVA Research Center, April 2026) · lvcva.com ↑ b c
- LVCVA Summary of Monthly Tourism Indicators for Las Vegas, NV — Year-End Summary for 2024 · lvcva.com ↑
- 2025 Las Vegas Visitor Profile Study (LVCVA Research Center) · lvcva.com ↑ b c d e f g h i j k l m
- Las Vegas International Visitation Estimates — 2024 International Visitation by Country & World Region (Prelim, Jan 2025) · assets.simpleviewcms.com ↑
- Las Vegas, NV – Best Campgrounds & RV Parks Nearby (The Dyrt) · thedyrt.com ↑
- Las Vegas, NV – Best Free Dispersed Camping Sites (The Dyrt) · thedyrt.com ↑
- Red Rock Canyon National Conservation Area · blm.gov ↑
- Las Vegas Visitor Statistics – 1970 to 2025 (LVCVA Research Center) · lvcva.com