

Updated
Olympic National Park key statistics
- 3,584,187 recreation visits in 20251
- 1,937,401 recreation visits from January to July 2026 (preliminary), up 4.4% on the same months of 20251
- 9th most visited of the 63 U.S. national parks in 20252
- 426,748 overnight stays in 2025, about 29% of them in tents3
- $380.18 million spent by visitors in 20244
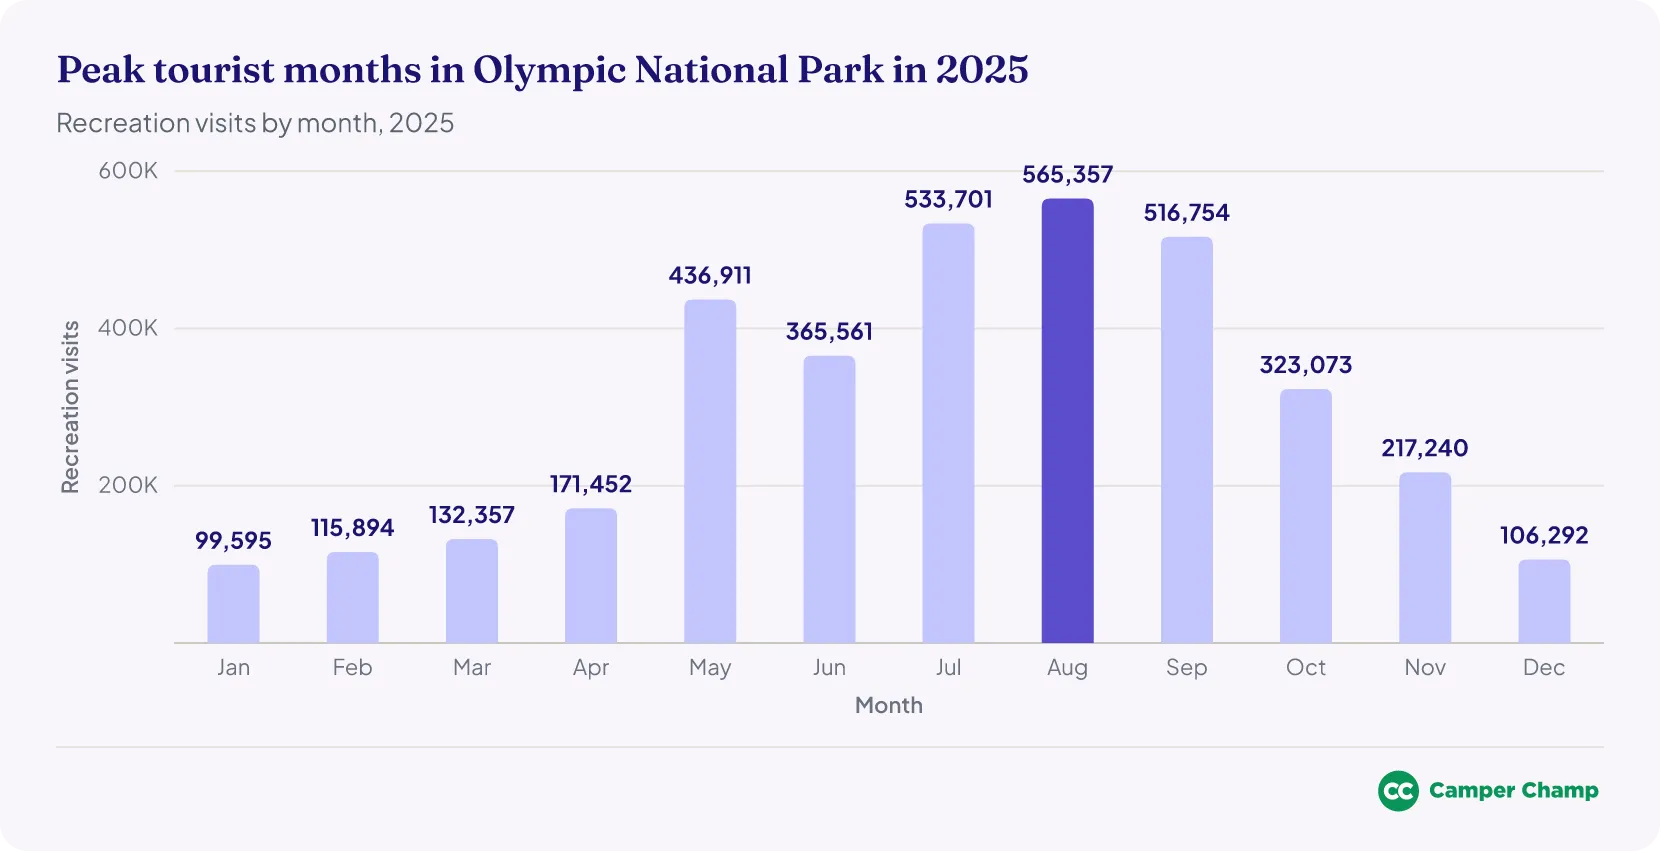
- August was the busiest month of 2025, with 565,357 visits1
- 922,651 acres, with 73 miles of wilderness coast5
How many people visit Olympic National Park each year?
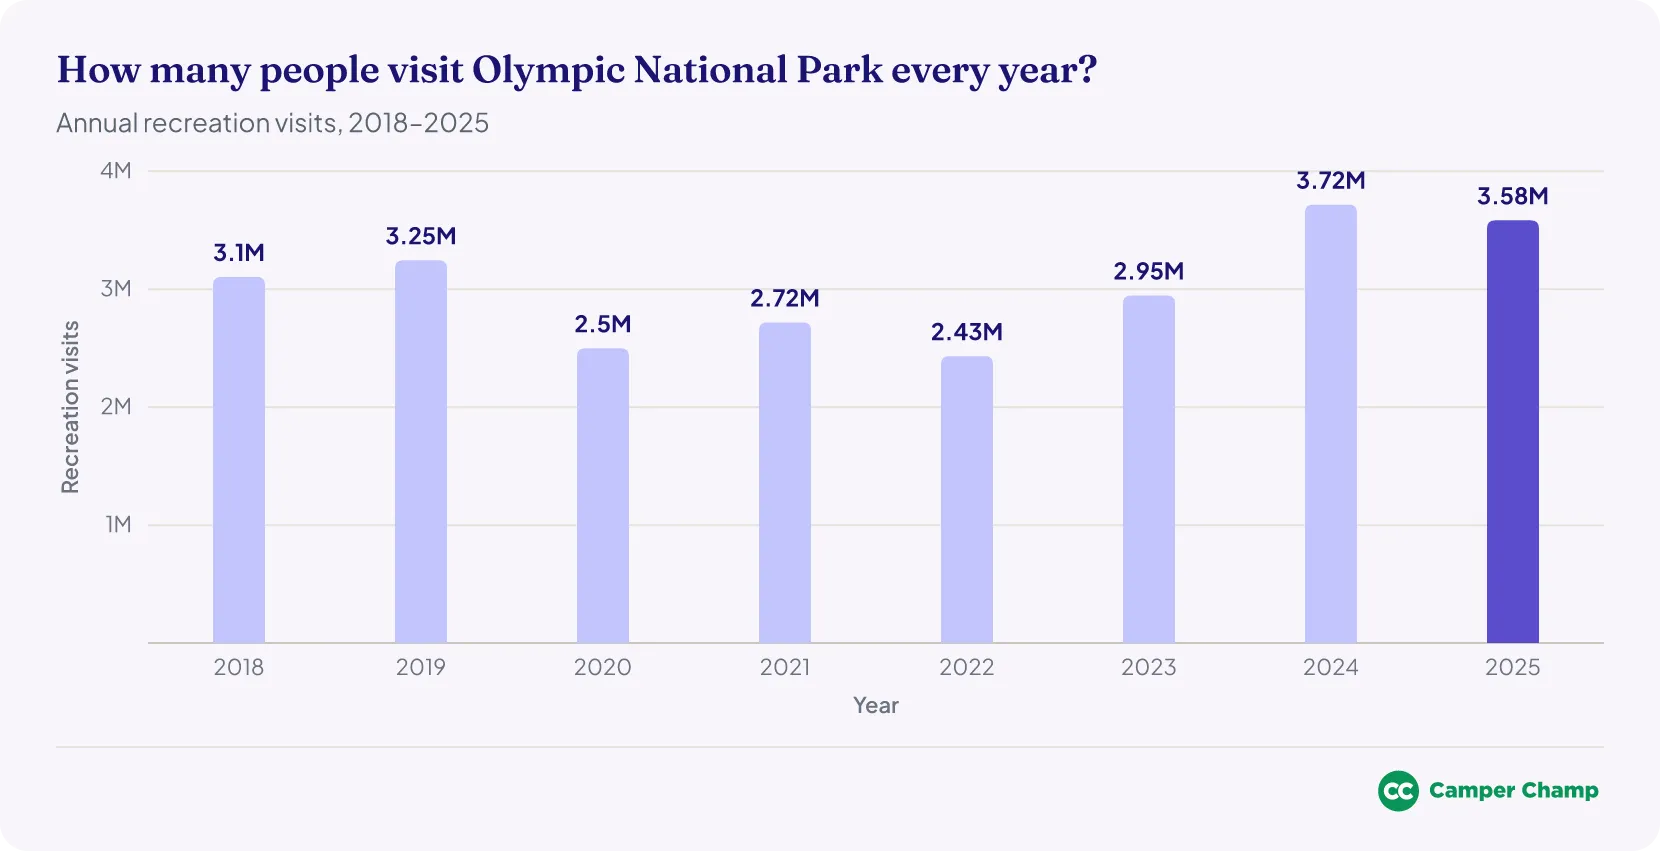
Olympic National Park had 3,584,187 recreation visits in 2025, or roughly 3.6 million.1
Year by year:
- 3,584,187 visits in 2025, down 3.6% from 2024.1 That is still 10.4% more than in 2019.
- 3,717,267 in 2024, up 26.1% from 2023 and the most since 1997.1
- 2,947,503 in 2023, up 21.1% from 2022.1
- 2,432,972 in 2022.1 That was the lowest total since 1983.
- 3,245,806 in 2019 (pre-pandemic).1 During the pandemic, the park had 2,499,177 visits in 2020 and 2,718,925 in 2021.
How much do visitors spend at Olympic National Park each year?
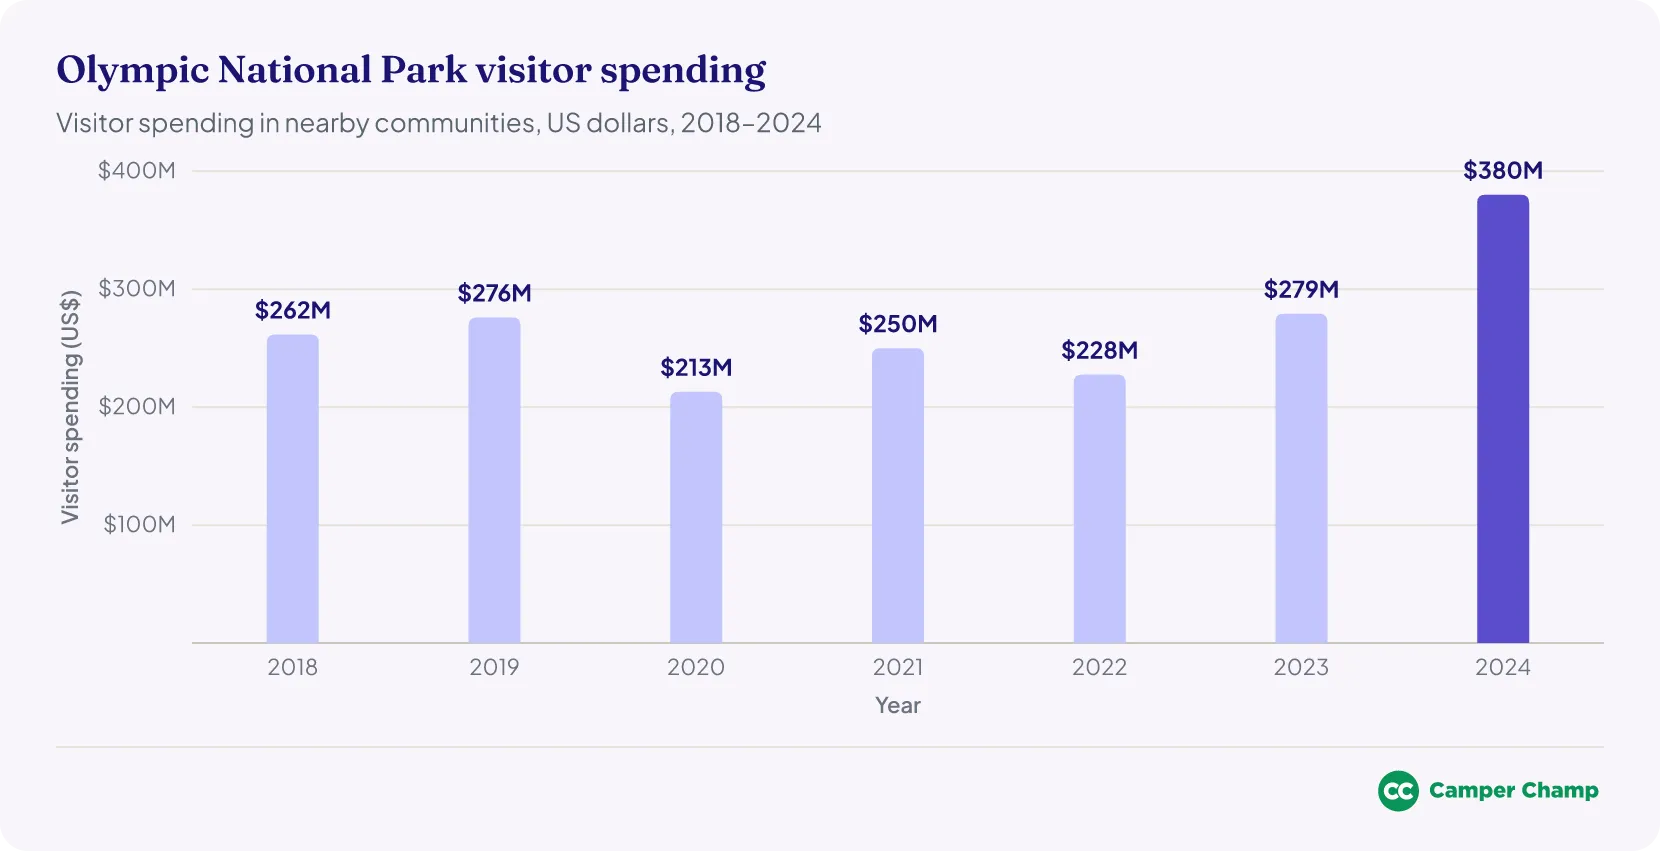
Visitors spent $380.18 million in communities near Olympic National Park in 2024.4
- $380.18 million in 2024, up 36.1% from $279.24 million in 20234
- $279.24 million in 2023, up 22.7% from $227.62 million in 20224
- $227.62 million in 20224, down 9.0% from $250.07 million in 2021
- $213.02 million in 20204, down from $276.11 million in 2019
In 2024, that spending supported 2,881 local jobs and $515.82 million in economic output.4
The National Park Service's spending figures for Olympic currently stop at 2024.4
How many people have visited Olympic National Park in 2026?
Olympic National Park recorded 1,937,401 recreation visits from January to July 2026, 4.4% more than the 1,855,471 recorded over the same months of 2025.1
- April 2026 drew 224,046 visits, up 30.7% from 171,452 in April 2025.1
- June 2026 brought 411,366 visits, up 12.5% from 365,561 in June 2025.1
- July 2026 was the busiest month so far, with 528,764 visits, 0.9% fewer than in July 2025.1
- January (93,180 visits, down 6.4%) and February (110,792, down 4.4%) were below their 2025 totals, while March and May came within 1% of theirs.1
Figures for August 2026 onward have not been released yet. The 2026 figures are preliminary; the National Park Service finalizes them by the end of the first quarter of the following year.1
| Month | 2025 visits | 2026 visits (preliminary) | Change |
|---|---|---|---|
| January | 99,595 | 93,180 | −6.4% |
| February | 115,894 | 110,792 | −4.4% |
| March | 132,357 | 133,028 | +0.5% |
| April | 171,452 | 224,046 | +30.7% |
| May | 436,911 | 436,225 | −0.2% |
| June | 365,561 | 411,366 | +12.5% |
| July | 533,701 | 528,764 | −0.9% |
| August | 565,357 | Not yet released | – |
| September | 516,754 | Not yet released | – |
| October | 323,073 | Not yet released | – |
| November | 217,240 | Not yet released | – |
| December | 106,292 | Not yet released | – |
| January–July | 1,855,471 | 1,937,401 | +4.4% |
Source · National Park Service (NPS) Visitor Use Statistics. 2026 figures are preliminary.
How many people visit Olympic National Park per day?
Olympic National Park averaged about 9,820 recreation visits a day in 2025.1 That is up from about 8,890 a day in 2019.
- August was the busiest month, averaging about 18,240 visits a day.1
- January was the quietest, averaging about 3,210 visits a day.1
How much does it cost to visit Olympic National Park?
Entry fees for Olympic National Park in 2026:
- $30 per vehicle (valid for 7 days)6
- $15 per person (walk-in or bicycle, valid for 7 days)6
- $25 per motorcycle (valid for 7 days)6
- $55 for an annual park pass6
Children under 16 entering on foot or by bicycle get in free. The park does not accept cash.6
Which parts of Olympic National Park are busiest?
The Park Service counts vehicles, not people, on the roads into the park's main areas. In 2025, the counts were highest at:
- Hurricane Ridge: 158,070 vehicles passed the fee station, 16.2% more than in 2024.7
- Ruby Beach: 131,554 vehicles entered the parking area, up 20.7%.7
- Hoh Rain Forest: 176,566 vehicles in 2024, the latest full year. The 2025 count of 138,147 is incomplete, as no vehicles were recorded from January to April.7
- Sol Duc: 59,481 vehicles on Sol Duc Road.7
- Rialto Beach and Mora: 45,916 vehicles on the Mora entrance road.7
- Ozette: 40,134 vehicles at the Ozette ranger station.7
The Park Service's 2000 survey of summer visitors points the same way: the most visited spots were the Hurricane Ridge Visitor Center (47% of visitor groups), the Hoh Rain Forest (44%), Lake Crescent (33%) and the main visitor center in Port Angeles (31%).8
| Area | Where counted | 2025 vehicles | 2024 vehicles | Change |
|---|---|---|---|---|
| Hurricane Ridge | Fee station | 158,070 | 135,991 | +16.2% |
| Hoh Rain Forest | Entrance station | 138,147* | 176,566 | – |
| Ruby Beach | Parking area entrance | 131,554 | 109,038 | +20.7% |
| Sol Duc | Sol Duc Road | 59,481 | 59,831 | −0.6% |
| Rialto Beach and Mora | Mora entrance road | 45,916 | 43,678 | +5.1% |
| Ozette | Ozette ranger station | 40,134 | 40,092 | +0.1% |
Source · National Park Service (NPS) Visitor Use Statistics, traffic counts. *No vehicles were recorded at the Hoh from January to April 2025.
How does Olympic rank among U.S. national parks?
- Olympic was the 9th most visited U.S. national park in 2025, with 3,584,187 recreation visits.9 Counting every National Park Service site, including monuments, memorials and recreation areas, it ranked 26th.
- UNESCO: Olympic was designated an International Biosphere Reserve in 1976 and a World Heritage Site in 1981.10
| Rank | Park | Recreation visits |
|---|---|---|
| 1 | Great Smoky Mountains NP | 11,527,939 |
| 2 | Zion NP | 4,984,525 |
| 3 | Yellowstone NP | 4,762,988 |
| 4 | Grand Canyon NP | 4,430,653 |
| 5 | Yosemite NP | 4,278,413 |
| 6 | Rocky Mountain NP | 4,171,431 |
| 7 | Acadia NP | 4,079,318 |
| 8 | Grand Teton NP | 3,800,648 |
| 9 | Olympic NP | 3,584,187 |
| 10 | Glacier NP | 3,136,557 |
| 11 | Cuyahoga Valley NP | 3,025,325 |
| 12 | Joshua Tree NP | 2,932,644 |
| 13 | Indiana Dunes NP | 2,629,497 |
| 14 | Hot Springs NP | 2,494,611 |
| 15 | Gateway Arch NP | 2,209,028 |
Source · Public Lands Data, from National Park Service (NPS) Visitor Use Statistics
How does Olympic compare with Washington's other national parks?
Olympic is Washington's most visited national park by far. In 2025, it had more than twice as many recreation visits as Mount Rainier, and about two-thirds of all visits to the state's three national parks.2
When is the best time to visit Olympic National Park?
Olympic National Park is open all year, but June to September are the most popular months to visit, when most roads and facilities are open.11 From October through May, some roads, campgrounds and visitor facilities close or have reduced hours.
- Summer (June to August): the busiest season, with warmer weather, long days and most trails and facilities open. It suits hiking, camping and exploring the park's mix of coast, mountains and rain forest.
- Late spring (May) and early fall (September): often the best balance, with good weather and smaller crowds than July and August.
- Winter (November to April): the season for winter sports, though some roads and facilities close.
When is Olympic National Park busiest?
In 2025, the park's busiest months were:
- August topped the list with 565,357 visits.1 It's one of the drier months, which makes it popular for hiking.
- July saw 533,701 visits1, and its moderate humidity suits wildlife watching and hiking.
- September attracted 516,754 visits1, with mild weather and early fall color.
- May and June had 436,911 and 365,561 visits1, as the weather warmed into early summer.
- October drew 323,073 visits1, when the fall foliage brings out photographers and nature lovers.
How much rain does Olympic National Park get?
Olympic's western coast and valleys get 100 to 170 inches of rain a year, while the park headquarters in Port Angeles, on the drier east side, averages only 25 to 30 inches.12 In the Hoh and Quinault rain forests, precipitation ranges from 140 to 167 inches (12 to 14 feet) a year.13
- Why the west is so wet: Storms from the Pacific drop most of their moisture as they rise over the Olympic Mountains, leaving the east side of the park in a rain shadow.12
- Snow: Hurricane Ridge traditionally records 30 to 35 feet of snow a year.12
- Rain forest temperatures: In the low rain forest valleys, the temperature seldom drops below freezing, and summer highs rarely exceed 80°F.13
How many people camp in Olympic National Park each year?
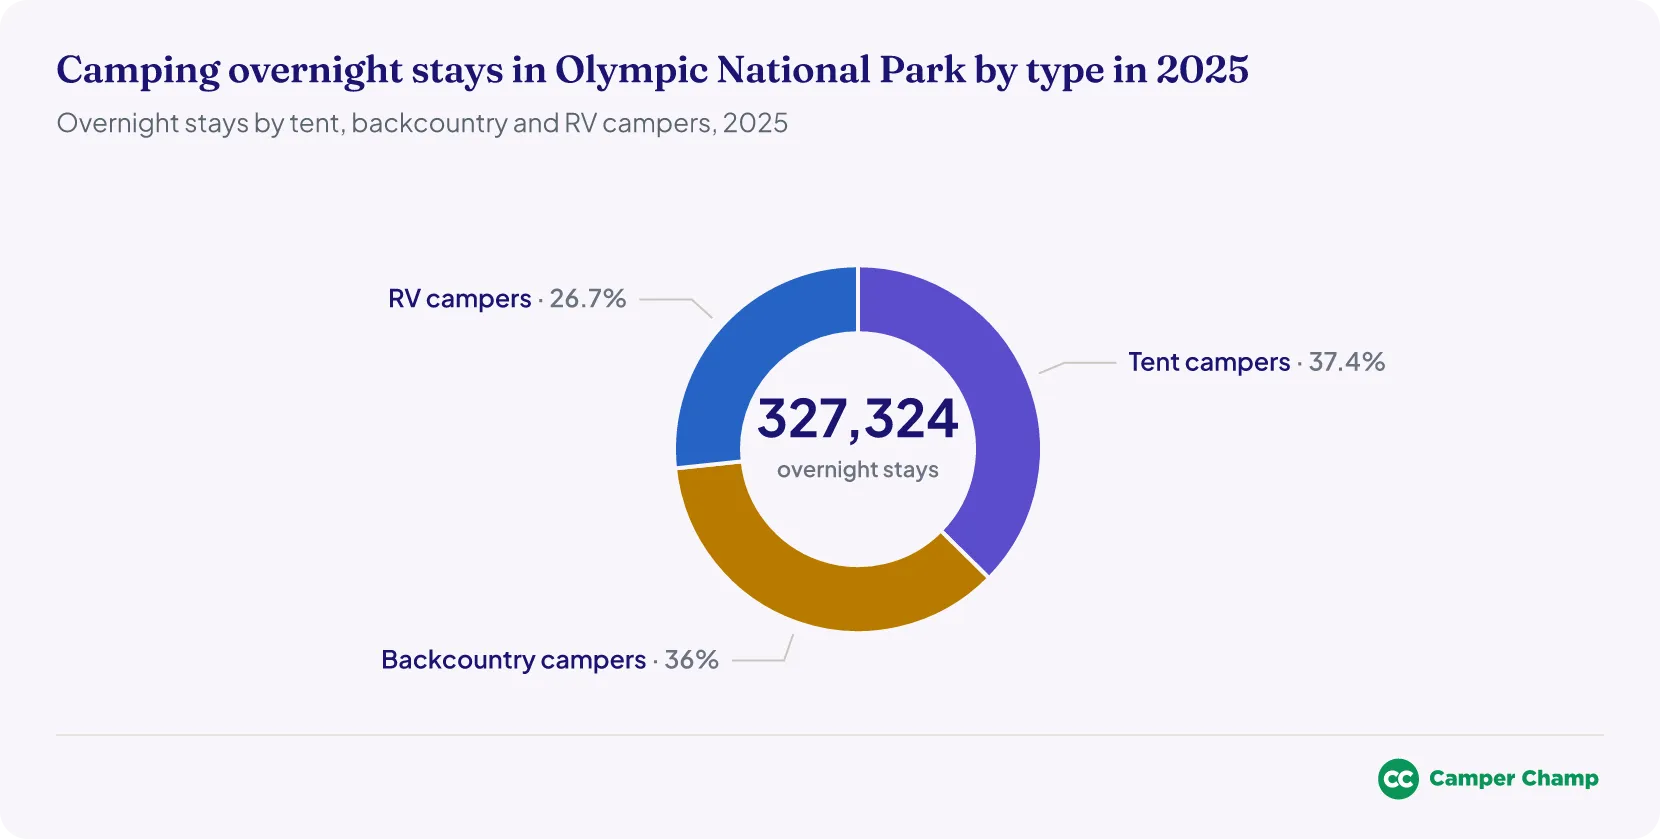
Olympic National Park recorded 426,748 overnight stays in 2025, 4.8% fewer than the 448,350 in 2024 but 4.0% more than the 410,189 in 2019.3 The National Park Service counts overnight stays (one person for one night), not individual campers, so one person camping for three nights counts three times.
In 2025, the stays broke down as:
- Tent camping: 122,340 overnight stays3
- Backcountry camping: 117,700 overnight stays3
- RV camping: 87,284 overnight stays3
- Lodges and cabins: 86,492 overnight stays3
- Concessioner-run campgrounds: 12,896 overnight stays3
- Other: 36 overnight stays3
For figures across the country, see our camping statistics in the US.
How do people camp in Olympic National Park?
Olympic National Park has 14 developed campgrounds.5 In 2025, tent campers made up about 29% of the park's 426,748 overnight stays, backcountry campers about 28% and RV campers about 20%.3
- Reservation campgrounds: Kalaloch (170 sites), Mora (94 sites), Fairholme (88 sites), Hoh Rain Forest (78 sites) and Staircase (49 sites) cost $24 a night and need a reservation in the summer season. Outside it, they are first-come, first-served.14
- First-come, first-served: Heart O' the Hills (97 sites) costs $24 a night; South Beach, Graves Creek, Ozette and North Fork cost $20; Queets and Deer Park cost $15.14
- Booking: Reservation sites can be booked on Recreation.gov up to six months ahead.14
- RVs: Most campgrounds have sites for RVs up to 21 feet, and a few up to 35 feet. Deer Park is tents only, and RVs and trailers are not allowed at Graves Creek. Full hookups are available at Log Cabin Resort and the Sol Duc Hot Springs RV Park.14
- Dump stations: Fairholme, Kalaloch and Mora have dump stations, at $10 per use.14
- Stay limits: You can camp up to 14 consecutive days a year in the park; at Kalaloch, Mora and Hoh, the limit is 7 days in the peak season.14
- Backpacking: Wilderness permits are required year-round and must be booked in advance, mostly on Recreation.gov. Permits for the summer season (May 15 to October 15) are released on April 15.15
- No roadside sleeping: Vehicle camping is allowed only in authorized campgrounds in the park.14
RV rental in the USA
- RV rental in Seattle
- Alaska RV rental
- RV rental in Atlanta
- Chicago RV rental
- RV rental in Cincinnati
- RV rental in Denver
- RV rental in Houston
- RV rental in Minneapolis
- Salt Lake City RV rental
- San Diego RV rental
Olympic National Park facts: size, history and landscape
- Location: Washington State's Olympic Peninsula, about 45 miles west of Seattle.10
- Establishment: Created as Mount Olympus National Monument in 1909, it became a national park in 1938.10
- Size: Covers 922,651 acres, and 95% of the park is designated wilderness.5
- Coastline: 73 miles of wilderness coast, with tidepools, sea stacks and secluded beaches.5
- Glaciers: 32 named glaciers, mostly high in the Olympic Mountains.5
- Trails and roads: 660 miles of trail and 171 miles of road.5
- Wildlife: Roosevelt elk, black bears and mountain lions, among 56 mammal species, and around 300 bird species.5
- Ecosystems: Rugged coastline, glacier-capped mountains and temperate rain forests such as the Hoh, where 140 to 167 inches (12 to 14 feet) of rain and snow fall each year.13
- Hurricane Ridge: Sweeping mountain views, hiking trails and winter recreation.
- Lake Crescent: A glacially carved lake known for its clear water and mountain backdrop.
- Recreation: Hiking, camping, fishing, kayaking and wildlife watching.
- Lodging: Four lodges operate inside the park: Kalaloch Lodge, Lake Crescent Lodge, Log Cabin Resort and Sol Duc Hot Springs Resort.16
What are the most common causes of visitor deaths in Olympic National Park?
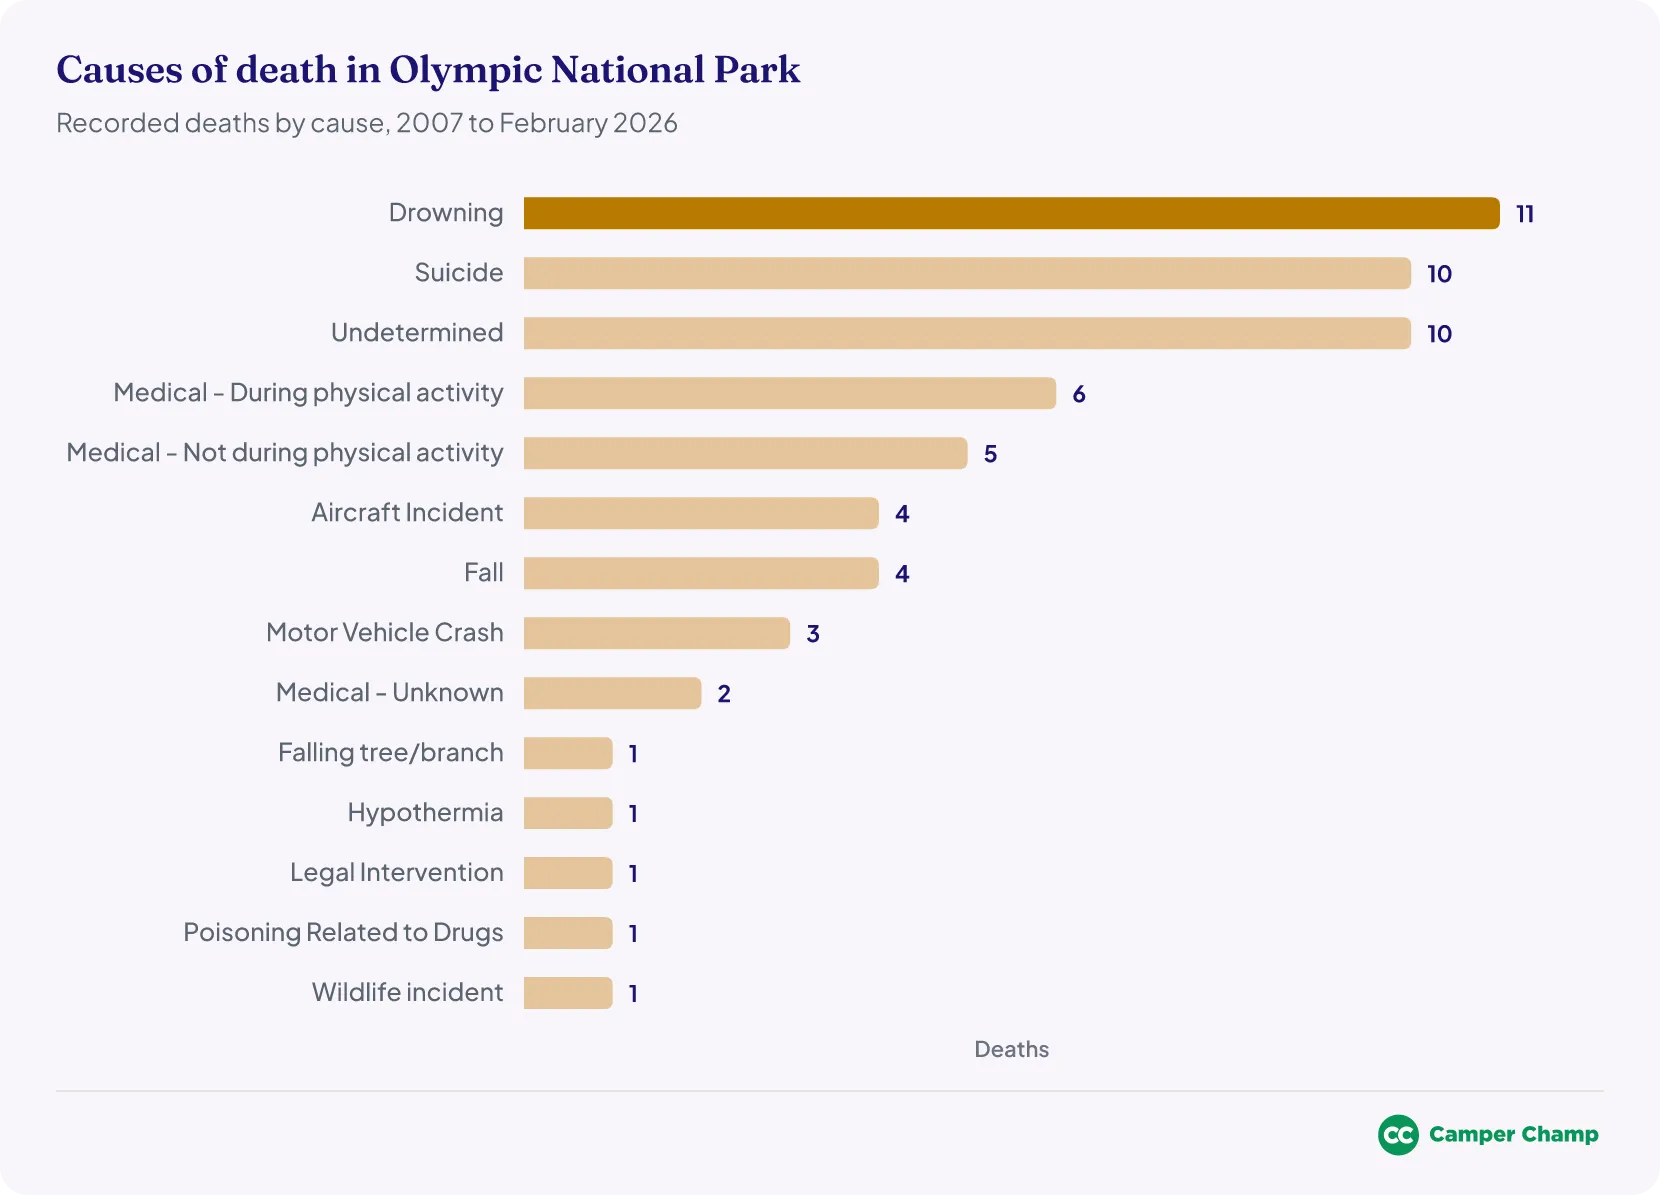
There were 60 recorded deaths in Olympic National Park between 2007 and February 2026.17 The recorded causes were:
- Drowning (11 deaths)17
- Suicide (10 deaths)17
- Undetermined (10 deaths)17
- Medical – during physical activity (6 deaths)17
- Medical – not during physical activity (5 deaths)17
- Aircraft incident (4 deaths)17
- Fall (4 deaths)17
- Motor vehicle crash (3 deaths)17
- Medical – unknown (2 deaths)17
- Falling tree or branch (1 death)17
- Hypothermia (1 death)17
- Legal intervention (1 death)17
- Drug-related poisoning (1 death)17
- Wildlife incident (1 death)17
Is Olympic National Park dangerous?
Deaths in Olympic National Park are rare for a park with about 3.6 million visits a year, but cold rivers and lakes and fast-changing weather call for care. Drowning is the most common recorded cause of death in the park, with 11 of the 60 deaths since 2007.17 Cellular access is spotty throughout the park, so don't count on your phone.18 A few precautions help keep you safe:
- Be ready for sudden weather changes: Dress in layers and bring waterproof gear.
- Stay on marked trails: It protects the ecosystem and keeps you from getting lost.
- Keep your distance from wildlife: Never approach or feed animals.
- Carry enough water: Also bring a way to purify it if needed.
- Bring a paper map and compass: GPS isn't always reliable.
- Plan for emergencies: Carry a basic first aid kit, know how to use it, and know where the nearest ranger station is.
- Take care near water and cliffs: River and lake currents can be strong, and cliff edges and unstable ground are best avoided.
Olympic National Park FAQs
How many days do you need in Olympic National Park?
Two to four days is typical. In a Park Service survey of Olympic's summer visitors in 2000, 50% of visitors spent 2 to 4 days in the park, while 32% of visitor groups spent less than a day.8
Can you take an RV to Olympic National Park?
Yes. Most campgrounds have sites for RVs up to 21 feet, and a few up to 35 feet. Fairholme, Kalaloch and Mora have dump stations ($10 per use). For full hookups, Log Cabin Resort and the Sol Duc Hot Springs RV Park have RV sites with electricity.14
Is there cell service in Olympic National Park?
Only in places. Cellular access is spotty throughout the park: areas near Port Angeles and Forks have reliable service, but elsewhere you should not expect it. There is no public Wi-Fi.18
How big is Olympic National Park?
Olympic National Park covers 922,651 acres, and 95% of it is designated wilderness. It includes 73 miles of wilderness coast and 32 named glaciers.5
More national park statistics
- Acadia National Park Tourism Statistics
- Big Bend National Park Tourism Statistics
- Biscayne National Park Tourism Statistics
- Grand Teton National Park Tourism Statistics
- Great Smoky Mountains National Park Tourism Statistics
- Joshua Tree National Park Tourism Statistics
- US National Parks Ranking
- Voyageurs National Park Tourism Statistics
- White Sands National Park Tourism Statistics
- Wildlife Statistics in the USA
- Yosemite National Park Tourism Statistics
- Zion National Park Tourism Statistics
References
- Recreation Visitors By Month (1979 – Last Calendar Year) — Olympic NP (NPS Visitor Use Statistics) · irma.nps.gov ↑ b c d e f g h i j k l m n o p q r s t u v w x
- Most Visited National Parks in 2025 — Ranked by Visitation · publiclandsdata.com ↑ b c d e f g
- Overnight Stays (1979 – Last Calendar Year) — Olympic NP (NPS Visitor Use Statistics) · irma.nps.gov ↑ b c d e f g h i
- NPS Visitor Spending Effects — park results, Olympic National Park (OLYM), 2012–2024 · irmaservices.nps.gov ↑ b c d e f g h
- Olympic Fun Facts: Olympic By The Numbers — Olympic National Park (U.S. National Park Service) · nps.gov ↑ b c d e f g h i
- Fees & Passes — Olympic National Park (U.S. National Park Service) · nps.gov ↑ b c d e f
- NPS Visitor Use Statistics — Traffic Counts, Olympic NP · irma.nps.gov ↑ b c d e f g
- Olympic National Park Visitor Study, Summer 2000 (Visitor Services Project Report 121) · npshistory.com ↑ b
- NPS Visitor Use Statistics — Annual Park Ranking Report for Recreation Visits, 2025 · irma.nps.gov ↑
- NPS Geodiversity Atlas—Olympic National Park, Washington (U.S. National Park Service) · nps.gov ↑ b c d
- Operating Hours & Seasons — Olympic National Park (U.S. National Park Service) · nps.gov ↑ b
- Weather — Olympic National Park (U.S. National Park Service) · nps.gov ↑ b c
- Temperate Rain Forests — Olympic National Park (U.S. National Park Service) · nps.gov ↑ b c
- Camping — Olympic National Park (U.S. National Park Service) · nps.gov ↑ b c d e f g h
- Wilderness Permits & Reservations — Olympic National Park (U.S. National Park Service) · nps.gov ↑ b
- Lodging — Olympic National Park (U.S. National Park Service) · nps.gov ↑ b
- NPS Mortality Data, CY2007 onward (Prevention and Response Branch FOIA release) · nps.gov ↑ b c d e f g h i j k l m n o p
- Basic Information — Olympic National Park (U.S. National Park Service) · nps.gov ↑ b
- NPS: Facts and Figures – Visitations, Spending, Ranking, and Park Reports · nps.gov